10-K: Annual report [Section 13 and 15(d), not S-K Item 405]
Published on March 25, 2025
UNITED STATES
SECURITIES AND EXCHANGE COMMISSION
WASHINGTON, DC 20549
FORM 10-K
(Mark One)
For the fiscal year ended December 29 , 2024
OR
For the transition period from __________________ to __________________
Commission file number: 001-15321

(Exact name of registrant as specified in its charter)
| (State or other jurisdiction of incorporation or organization) | (IRS Employer Identification No.) | |||||||
(Address of principal executive offices, including zip code)
Registrant’s telephone number, including area code: (757 ) 365-3000
Securities registered pursuant to Section 12(b) of the Act
| Title of each class | Trading Symbol(s) | Name of each exchange on which registered | ||||||||||||
Indicate by check mark if the registrant is a well-known seasoned issuer, as defined in Rule 405 of the Securities Act. Yes ☐ No ☒
Indicate by check mark if the registrant is not required to file reports pursuant to Section 13 or Section 15(d) of the Act. Yes ☐ No ☒
Indicate by check mark whether the registrant (1) has filed all reports required to be filed by Section 13 or 15(d) of the Securities Exchange Act of 1934 during the preceding 12 months (or for such shorter period that the registrant was required to file such reports), and (2) has been subject to such filing requirements for the past 90 days. Yes ☐ No ☒
Indicate by check mark whether the registrant has submitted electronically every Interactive Data File required to be submitted pursuant to Rule 405 of Regulation S-T (§232.405 of this chapter) during the preceding 12 months (or for such shorter period that the registrant was required to submit such files). Yes ☒ No ☐
Indicate by check mark whether the registrant is a large accelerated filer, an accelerated filer, a non-accelerated filer, a smaller reporting company, or an emerging growth company. See the definitions of “large accelerated filer,” “accelerated filer,” “smaller reporting company,” and “emerging growth company” in Rule 12b‑2 of the Exchange Act.
| Large accelerated filer | ☐ | Accelerated filer | ☐ | ||||||||
| ☒ | Smaller reporting company | ||||||||||
| Emerging growth company | |||||||||||
If an emerging growth company, indicate by check mark if the registrant has elected not to use the extended transition period for complying with any new or revised financial accounting standards provided pursuant to Section 13(a) of the Exchange Act. ☐
Indicate by check mark whether the registrant has filed a report on and attestation to its management’s assessment of the effectiveness of its internal control over financial reporting under Section 404(b) of the Sarbanes‐Oxley Act (15 U.S.C. 7262(b)) by the registered public accounting firm that prepared or issued its audit report. ☐
If securities are registered pursuant to Section 12(b) of the Act, indicate by check mark whether the financial statements of the registrant included in the filing reflect the correction of an error to previously issued financial statements. ☐
Indicate by check mark whether any of those error corrections are restatements that required a recovery analysis of incentive‐based compensation received by any of the registrant’s executive officers during the relevant recovery period pursuant to §240.10D‐1(b). ☐
Indicate by check mark whether the registrant is a shell company (as defined in Rule 12b‑2 of the Exchange Act). Yes ☐ No ☒
The aggregate market value of the registrant’s common stock held by non-affiliates as of June 30, 2024 the last business day of the registrant’s most recently completed second fiscal quarter was $0.00 . The Registrant’s units began trading on January 28, 2025.
As of March 24, 2025, the registrant had 393,112,711 shares of common stock, no par value, outstanding.
Documents Incorporated by Reference: Portions of the Proxy Statement for the Annual Meeting of Shareholders to be held June 3, 2025 are incorporated by reference into Part III, Items 10-14. The Proxy Statement will be filed with the Securities and Exchange Commission within 120 days after the end of the fiscal year to which this report relates.
TABLE OF CONTENTS
| Page | ||||||||
| Part I | ||||||||
| Item 1. | Business | |||||||
| Item 1A. | Risk Factors | |||||||
Item 1B. |
Unresolved Staff Comments | |||||||
Item 1C. |
Cybersecurity Disclosure | |||||||
| Item 2 | Properties | |||||||
| Item 3. | Legal Proceedings | |||||||
| Item 4. | Mine Safety Disclosures | |||||||
| Part II | ||||||||
| Item 5 | Market for Registrant’s Common Equity, Related Stockholder Matters and Issuer Purchases of Equity Securities | |||||||
| Item 6 | Selected Financial Data | |||||||
| Item 7 | Management’s Discussion and Analysis of Financial Condition and Results of Operations | |||||||
| Item 7A | Quantitative and Qualitative Disclosures About Market Risk | |||||||
| Item 8 | Financial Statements and Supplementary Data | |||||||
| Item 9 | Changes in and Disagreements With Accountants on Accounting and Financial Disclosure | |||||||
| Item 9A | Controls and Procedures | |||||||
| Item 9B | Other Information | |||||||
| Item 9C | Disclosure Regarding Foreign Jurisdictions that Prevent Inspections | |||||||
| Part III | ||||||||
| Item 10 | Directors, Executive Officers and Corporate Governance | |||||||
| Item 11 | Executive Compensation | |||||||
| Item 12 | Security Ownership of Certain Beneficial Owners and Management and Related Stockholder Matters | |||||||
| Item 13 | Certain Relationships and Related Transactions, and Director Independence | |||||||
| Item 14 | Principal Accountant Fees and Services | |||||||
| Part IV | ||||||||
| Item 15 | Exhibits, Financial Statement Schedules | |||||||
| Item 16 | Form 10-K Summary | |||||||
ITEM 1. BUSINESS
Our Company
Headquartered in Smithfield, Virginia, since 1936, Smithfield Foods, Inc., together with its subsidiaries (“Smithfield,” “the Company,” “we,” “us” or “our”), produces a wide variety of packaged meats and fresh pork products primarily in the United States (“U.S.”). Smithfield is an American food company that employs approximately 34,000 people in the U.S. and 2,500 people in Mexico. Smithfield’s portfolio includes high-quality iconic brands, such as Smithfield®, Eckrich® and Nathan’s Famous®, among many others. Smithfield is a majority owned subsidiary of Hong Kong-based WH Group Limited (“WH Group”).
Our Mission
Good food. Responsibly.® At Smithfield, we are helping to feed a world of nearly eight billion people. Our products are found on tables everywhere. We provide families with wholesome, safe and affordable food while finding new and innovative ways to care for our people, communities, animals and planet. It is our responsibility and our promise. We make more than good food. Good is what we do.
Our Operations
We conduct our operations through three reportable segments: Packaged Meats, Fresh Pork, and Hog Production. We also conduct operations through two other operating segments, Mexico and Bioscience, which are aggregated and reported as “Other.”
Packaged Meats Segment
The Packaged Meats segment consists of our U.S. operations that process fresh meat into a wide variety of packaged meats products, including bacon, sausage, hot dogs, deli and lunch meats, dry sausage products (such as pepperoni and genoa), ham products, ready-to-eat products and prepared foods (such as pre-cooked entrees, bacon and sausage). Approximately 80% of the Packaged Meats segment’s raw materials are sourced from our Fresh Pork segment. We market our domestic packaged meats products under a strategic set of core brands, which include: Smithfield, Eckrich, Nathan’s Famous, Farmland, Armour, Farmer John, Kretschmar, Krakus, John Morrell, Cook’s, Gwaltney, Carando, Margherita, Curly’s and Smithfield Culinary. We also sell a sizeable portion of our packaged meats products as private label products. The majority of the Packaged Meats segment’s products are sold to retail and foodservice customers in the U.S.
Fresh Pork Segment
The Fresh Pork segment consists of our U.S. operations that process live hogs into a wide variety of primal, sub-primal and offal products, such as bellies, butts, hams, loins, picnics and ribs. In fiscal year 2024, the Fresh Pork segment sourced approximately half of its raw materials from our Hog Production segment and half from independent farmers with whom we partner across the U.S. In fiscal year 2025, we expect that approximately 40% of the hogs processed by the Fresh Pork segment will be sourced from the Hog Production segment as a result of our new partnerships in Murphy Family Farms and VisionAg, which are described under “Recent Developments—Hog Production Reform” below. Approximately one-third of our fresh pork products, including the majority of hams, bellies and trimmings, is transferred to our Packaged Meats segment. Externally, we sell our fresh pork products to domestic retail, foodservice and industrial customers, as well as to export markets, including, among others, China, Mexico, Japan, South Korea and Canada.
Hog Production Segment
The Hog Production segment consists of our hog production operations in the U.S., which produce and raise our hogs on numerous company-owned farms and farms that are owned and operated by third-party contract farmers. Nearly all of the hogs produced by this segment are processed by our Fresh Pork segment. The Hog Production segment also sells grains to external customers.
Other Segments
2
Mexico. In Mexico, we own a 66% interest in Granjas Carroll de Mexico, S. de R.L. de C.V. (“Altosano”), which raises hogs and produces fresh pork products that are sold primarily to customers in Mexico.
Bioscience: Our Bioscience operations use raw materials from hogs that we process to manufacture heparin products, including an active pharmaceutical ingredient that mitigates the risk of blood clots. These intermediate products are sold to the healthcare industry for use in pharmaceutical drugs and medical devices.
Recent Developments
Initial Public Offering
On January 29, 2025, we completed our initial public offering (“IPO”) of 26,086,958 shares of common stock, which represents 7% of the total outstanding shares, at a price of $20.00 per share. We issued 13,043,479 shares of common stock bringing the total number of outstanding shares to 393,112,711. The remaining 13,043,479 shares of common stock were sold by our existing shareholder. Our existing shareholder granted the underwriters a 30-day option to purchase up to 3,913,042 additional shares of our common stock. On February 20, 2025, the underwriters partially exercised such option and purchased 2,506,936 additional shares of common stock from our existing shareholder. We received net proceeds from the IPO of approximately $236 million after deducting underwriting discounts, commissions and fees. As a result of the IPO, our common stock is listed on the Nasdaq Global Select Market under the ticker “SFD.”
European Carve-Out
On August 26, 2024, we completed a carve-out and transfer of our European operations to WH Group. The European carve-out represents a strategic shift in our geographical footprint. Accordingly, the results of operations, assets and liabilities, and cash flows of the European operations have been condensed and reported as discontinued operations in the consolidated financial statements for all periods presented.
Hog Production Reform
We have taken a number of actions over the last couple of years to restructure and optimize the size of our hog production operations, including:
•In May 2023, we made a decision to cease operations on a number of sow farms in Missouri. The decision was driven by persistent livestock disease issues, underperforming operations and shifting industry supply and demand dynamics.
•In fiscal years 2023 and 2024, we terminated certain agreements with underperforming contract farmers and closed certain farms in the eastern U.S.
•On December 27, 2024, we became a member of a North Carolina-based company, Murphy Family Farms LLC (“Murphy Family Farms”), by contributing $3 million in cash in exchange for a 25% minority interest. In connection with the transaction, we sold approximately 150,000 sows and the associated commercial hog inventories located on company-owned and contract farms in North Carolina to Murphy Family Farms. Murphy Family Farms is now a hog supplier to us and will supply approximately 3.2 million hogs annually. We will supply animal feed and other supplies and provide certain support services to Murphy Family Farms.
•On February 24, 2025, we became a member of a North Carolina-based company, VisionAg Hog Production, LLC (“VisionAg”), by contributing $450,000 in cash in exchange for a 9% minority interest. In connection with the transaction, we sold approximately 28,000 sows and the associated commercial hog inventories located on certain company-owned and contract farms in North Carolina to VisionAg. VisionAg is now a hog supplier to us and will supply approximately 600,000 hogs annually. In addition, we will supply animal feed and provide certain support services to VisionAg.
Our Growth Strategies
3
The strategic initiatives we are executing across our segments are complemented and enabled by our strong balance sheet and ongoing operational investments, positioning us for future growth.
Drive Growth of Packaged Meats
Our Packaged Meats segment is core to our growth strategy and has been a major driver in transforming our business since 2014. We have methodically shifted our business mix to focus on this higher-margin segment over time. The segment contributed 59% of our sales and 105% of our overall operating profit in fiscal year 2024.
We plan to accelerate the growth of our Packaged Meats segment through several strategic initiatives, including:
•continuing to shift our portfolio toward a higher mix of value-added and premium products, such as:
•converting one-time seasonal commodity bone-in ham purchase occasions to increased unit sales of everyday, convenient products such as quarter-weight ham, Anytime Favorites ham and Prime Fresh sliced lunch meat; and
•increasing penetration of higher-margin dry sausage products through expanding distribution points and manufacturing capacity;
•harnessing our powerful brands to continue to expand product offerings and drive awareness, loyalty and increased market share;
•leveraging the breadth of our platform and national and specialty brands to further penetrate dayparts and households;
•expanding in under-indexed geographical locations and moving into new categories;
•attracting new consumers, particularly younger demographics, through product and packaging innovation and effective and appealing marketing strategies while maintaining our promise to consumers to offer high-quality products for every budget; and
•deepening our presence across our distribution channels through our integrated sales force, which leverages our scale and breadth to provide a unified, reliable and consistent customer experience.
We believe that these proven strategies will drive profitable organic growth in our Packaged Meats segment. As an example, we see significant potential for our Packaged Meats segment to generate continued growth through our distribution expansion opportunities across brands to expand unit count within our existing product portfolio.
Further Enhance Fresh Pork
We continually seek greater efficiencies as we manufacture and market fresh pork products. Our capabilities and supply chain allow us to provide differentiated products and high service levels to our customers. We deliver a high-quality, consistently available supply to our Packaged Meats segment and maximize the value of our raw materials. We will seek to enhance the profitability of our Fresh Pork segment by:
•maximizing the value of each hog and expanding use of raw materials, including unprocessed fresh and value-added pork, snacks, pharmaceuticals and pet food treats and ingredients;
•capitalizing on export markets as an outlet for increasing the value of raw materials through whole-hog utilization, and appealing to differentiated, global tastes and preferences;
•leveraging our relationship with WH Group to inform product development opportunities for the Asian market and to benefit from WH Group’s distribution network; and
•appealing to ever-changing consumer preferences and demand for flavor enhancements through ongoing product innovation.
4
As we seek to grow our fresh pork business profitably, we remain committed to demonstrating that profitability can go hand-in-hand with sustainable operations. We will further our mission of producing good food the right way by seeking new and unique ways to use our raw materials.
Continue Investing in Innovation
We will continue to invest in product, packaging and operational innovations in our Packaged Meats and Fresh Pork segments to drive growth, enhance our profitability and expand our total addressable market. We are focused on strengthening relationships with customers and consumers by being first-to-market with new products and solutions.
Within our branded packaged meats portfolio, we are introducing more value-added and premium innovations. We see a significant opportunity to increase distribution of our innovative Smithfield Prime Fresh packaged lunch meat offering. Smithfield Prime Fresh embodies the quality of bulk deli meat but is displayed in the packaged lunch meat section of the retail wall. This enables our retail partners to increase average revenue per pound and reduce in-store labor costs while providing a convenient lunch meat option for consumers.
In addition, our Smithfield Double Thick/Double Smoked bacon and Smithfield Maple Thick Cut bacon demonstrate our ability to introduce premium, higher-margin offerings with new cut and flavor characteristics. These products sell at a higher velocity than the category average.
In the Fresh Pork segment, we are investing in value-added products and adding new cuts and flavors, such as Sweet & Smokey BBQ, Chipotle and Lemon & Garlic marinated fresh pork loin filet.
Innovation does not stop with our products. In our plants, we are committed to advancing automation and strategically redeploying labor. On our farms, innovative approaches to animal nutrition are increasing feed conversion and lowering our cost basis. Byproducts that were once considered waste are now used to create renewable natural gas through our biogas joint ventures and lifesaving pharmaceuticals through our bioscience business.
Our culture of responsibility, operational excellence and innovation serves as a catalyst for our ongoing business transformation. We conduct company-wide competitions and recognition events for grassroots projects that drive innovation throughout our organization. By fostering this entrepreneurial spirit, we will seek to drive growth in our top- and bottom-line results and build on Smithfield’s competitive advantage.
Optimize Our Operations and Supply Chain to Decrease Our Cost Basis
We have implemented many initiatives over the past several years to reduce costs and realize operational efficiencies. These initiatives have enabled us to offset inflation and enhance margins across our entire business.
We continue to optimize the size of our company-owned hog production operations and procure a greater mix of hogs from independent suppliers with market-based supply agreements. Additionally, we continue to implement cost-saving initiatives in our retained hog production operations to improve our cost structure.
We employ automation in all of our plants to redeploy labor to higher value tasks, improve yields and drive efficiency by reducing complexity to lower our cost basis and help offset inflationary pressures.
In our logistics and distribution network, we have reduced transportation and warehousing costs through transportation efficiencies, maximizing utilization of our storage and trucking assets, improving supply and demand
5
planning and optimizing inventory levels. These actions increase profitability and improve customer service levels, which we believe is essential to being a supplier of choice.
We remain committed to optimizing our operations and supply chain through a series of targeted actions, which in the past have supported meaningful margin improvement:
| Hog Production | Packaged Meats & Fresh Pork | Logistics | ||||||
| “Reform and Rationalize” | “Best-In-Class Lean Manufacturing” |
“Improve Service at Optimal Cost” |
||||||
|
•Optimize number of company-owned hogs
•Improve herd health
•Transform genetics
•Drive procurement and nutrition savings
|
•Offset inflation with cost savings programs
•Employ automation
•Improve yields and maximize raw material usage
•Reduce complexity
|
•Be the supplier of choice
•Maximize assets (reduce transport miles, warehouse utilization)
•Improve supply and demand planning
•Optimize inventory levels
|
||||||
Implementation of our growth strategies requires us, in particular, to continue to grow our Packaged Meats segment and to reduce our exposure to commodity price volatility through optimization and continued reduction of the size of our company-owned hog production operations. For information about challenges that we face in implementing this strategy and our other growth strategies, please see “Item 1A. Risk Factors—Risks Relating to Our Business and Operations—Our results of operations are cyclical and could be adversely affected by fluctuations in the commodity prices for meat, livestock (primarily hogs) and feed ingredients,” and “Item 1A. Risk Factors—Risks Relating to Our Business and Operations—Disruption of our supply chain could adversely affect our business, financial condition and results of operations.”
Execute Synergistic Mergers and Acquisitions in North America
We intend to execute opportunistic, complementary mergers and acquisitions to bolster our value-added product portfolio and production capacity in North America. While acquisitions are not a primary growth driver for us, our team is experienced in identifying strategic acquisition targets and integrating them successfully into our business. We believe our integration expertise allows us to capture both cost synergies and incremental revenue opportunities. We will remain disciplined in our acquisition approach and maintaining our investment grade ratings, while pursuing opportunities that we believe will prove accretive to earnings and enhance our operational profile.
Trends in Market Demand
We operate in the large and growing global packaged and fresh meats market, which includes value-added fresh, refrigerated and frozen proteins. Our business operations are primarily concentrated in North America, but, as a leading exporter to major international markets, we also benefit from significant global demand for our products.
The U.S. packaged meats market is supported by long-term secular tailwinds, including consumer demand for high-protein diets, high-quality nutrition, product versatility and convenience. We expect these tailwinds to continue to drive increases in overall meat consumption. Nevertheless, changes in market trends, consumer preferences and the impact of macroeconomic factors on consumer spend could adversely affect our results of operations. For more information, see “Item 1A. Risk Factors—Risks Relating to Our Business and Operations—Changes in consumer preferences and failure to maintain favorable consumer perception of our brands and products could negatively impact our business.”
Global demand for pork and pork products supports strong U.S. pork exports. According to the U.S. Department of Agriculture (“USDA”), the U.S. share of the global pork export market increased to 26% in 2022 from 2% in 1990. While the European Union is currently the world’s largest pork exporter, the U.S., at number two, is emerging as a more cost-effective alternative due to lower feed and labor costs, according to the Agriculture and Horticulture Development Board. According to the USDA, total U.S. pork product export volume was 3.2 million tons in 2024.
6
Sales and Marketing
Our goal is to provide quality and value to the ultimate consumers of our packaged meats and fresh pork products. We sell our branded and private label packaged meats and fresh pork products through a variety of channels, including:
•national and regional retailers (primarily grocery supermarket chains, independent grocers and club stores);
•the foodservice industry, including foodservice distributors, fast food and other restaurants, hotel chains and other institutional customers;
•industrial customers who use our products as raw materials in their finished goods production, including prepared meals, byproducts for pharmaceutical production and pet food treats and ingredients; and
•export sales to international retailers and wholesale distributors, primarily in North American, Asian, Latin American and other emerging markets.
We use a variety of consumer advertising and trade promotion programs designed to build awareness and increase sales distribution and penetration. We also provide sales incentives to certain of our customers through rebates, such as those based on achievement of specified volume and/or growth in volume levels. We primarily use company-employed salespersons to sell our products, and we also engage independent brokers who work on a commission basis.
Customers
In fiscal year 2024, we sold our products to approximately 5,600 customers. Walmart Inc. (“Walmart”) is a customer of our Packaged Meats and Fresh Pork segments and accounted for approximately 13%, 12% and 12% of our consolidated sales in fiscal years 2024, 2023 and 2022, respectively. Walmart has been our customer for multiple decades. No other customer accounted for 10% or more of our consolidated sales during fiscal years 2024, 2023 and 2022. Cumulatively, our top ten customers accounted for 38%, 37% and 36% of our consolidated sales in fiscal years 2024, 2023 and 2022.
Manufacturing Facilities
We manufacture packaged meats, fresh pork and value-added items at 39 processing plants across 19 different states:
•Packaged meats. We produce packaged meats products across 31 processing plants in 18 states.
•Fresh pork. We process hogs at eight processing plants in six states, with the aggregate processing capacity of our collective processing plants of approximately 108,000 hogs per day.
•Value-added items. We operate six additional processing plants that use our fresh pork products to produce value-added items, such as case-ready products, pork skins for snacking and pet food and treats.
Our processing plants are strategically located to access raw materials in a cost-effective manner and to service our diverse customer base. Six of our fresh pork processing plants also include packaged meats operations, which improves our overall cost structure by reducing the cost of transporting fresh raw materials and leveraging shared fixed overheads.
We continue to optimize our operations by reconfiguring our manufacturing footprint, closing high-cost operating lines and creating greater agility across our facilities. Our facilities utilize modern, highly automated equipment to process and package our packaged meats and fresh pork products, aiding us in redeploying our team members to higher-value tasks. We believe that these expenditures have enhanced product quality, improved customer satisfaction and increased sales potential. Our economies of scale and network afford us significant supply chain transparency and substantial availability of high-quality raw material supply to our growing Packaged Meats segment. Our portfolio of production facilities requires routine capital investment for repairs and maintenance. We
7
believe that annual total capital expenditures in the near term are likely to be in the range of $400 million to $500 million inclusive of both repairs and maintenance and profit improvement projects. Capital expenditures could be more in certain years to ensure continuity of production in our older assets.
Our facilities are also designed to promote regulatory compliance and worker safety, as well as reduced waste and emissions, while seeking to comply with applicable environmental standards.
Our Mexico operations produce 1.8 million hogs annually at 115 company-owned farms and processes 1.5 million hogs at one manufacturing plant. Our Bioscience manufacturing location in Ohio processes raw materials from hogs that we process to manufacture heparin products, including Heparin Sodium, an active pharmaceutical ingredient, which mitigates the risk of blood clots.
Distribution and Transportation
We have integrated, centralized teams that coordinate supply and demand planning, customer service and logistics to service our packaged meats and fresh pork customer base. We use a combination of third-party shipping companies and our leased and owned fleet of tractor trailers to distribute meat products to our customers, as well as to move products between facilities. In the U.S., we distribute products directly from some of our plants and from owned and leased distribution centers in Indiana, Kansas, Maryland, Nebraska and North Carolina. We use these distribution centers to consolidate products that are manufactured at different plants across our network to fulfill our customer orders efficiently. One of these distribution centers is operated by third-party logistics providers.
Due in part to the different demands of distribution for frozen and refrigerated products, as well as the seasonality of certain of our products, we use a network of over 45 third-party cold storage locations for storage, handling and other value-added services. These arrangements are generally contracted on an annual basis with either fixed or variable usage requirements. Access to these locations provides capacity to sell frozen and chilled product offerings to our export customer base. For export sales to overseas geographies, we contract with third-party international container shipping carriers to ship our products cost effectively to the destination ports of our customers.
Our distribution network enables us to enhance our customer reach and sell our products efficiently and cost effectively throughout the U.S. and the world. We continue to seek innovative solutions to accomplish this mission. We use automation in our distribution centers to pick and fulfill orders and thereby reduce labor costs. We coordinate deliveries and use backhauling to reduce overall transportation costs.
Raw Materials
Feed for Internally Sourced Hogs
The primary raw materials for hog production are corn, soybean meal and wheat. Hogs consume grain during the grow-out period from wean to finish, which takes six months on average. Feed costs account for approximately 60% to 65% of our Hog Production raising cost. We have over 50 locations used for feed production and feed storage in the U.S., which are located near our farms, where we convert purchased grain into feed for our animals.
Feed grains are readily available from numerous sources at competitive prices, and we believe such raw materials to be in adequate supply. We take an active role in the physical markets for grain and other feed ingredients throughout the world. These efforts range from buying lower-cost corn from local farmers near our feed mills to importing grain or soybean meal from South America from time to time.
We seek to mitigate higher input costs through productivity initiatives to improve feed conversion, procurement initiatives and the use of derivative instruments to hedge a portion of forecasted future consumption economically. We seek to stabilize pricing generally by purchasing grains through forward purchase contracts.
8
Raw Materials for Fresh Pork Segment
Internally Sourced Hogs
In fiscal year 2024, we sourced approximately half of the hogs processed in our Fresh Pork segment’s facilities from our Hog Production segment. In fiscal year 2025, we expect that approximately 40% of the hogs processed by our Fresh Pork segment will be sourced from our Hog Production segment as a result of the new partnerships in Murphy Family Farms and VisionAg. Our Hog Production segment consists of more than 250 company-owned farms and more than 1,300 contract farms in the U.S. that raise our hogs for processing. Contract farmers provide the initial facility investment, labor and front-line management through a pre-determined economic and commercial arrangement, and we provide the animals and the feed.
In fiscal year 2024, we produced 14.6 million hogs from approximately 750,000 sows. We expect to produce 11.5 million hogs in fiscal year 2025 from approximately 570,000 sows. Nearly all of the Hog Production segment’s hogs are sold to the Fresh Pork segment.
We develop breeding stock, optimize diets for our hogs at each stage of the growth process, feed our hogs and design hog containment facilities. From the process’s origin at the grain farms to the ultimate step of delivering hogs to our processing plants, we monitor the vertically integrated process at every juncture to ensure a premium level of product, assurance of supply and control of input costs. Whether our animals are raised on company-owned or contract farms, we seek to have a supply chain that meets our standards for quality and animal welfare practices.
At our company-owned and contract farms, we have ongoing initiatives to improve profitability, including genetic transformation, herd health improvements and procurement and nutrition savings. These ongoing initiatives are intended to improve the livability of our animals while reducing costs. We utilize our fleet of leased and owned tractor trailers to transport hogs between farm and production facilities.
Externally Sourced Hogs
We procure hogs that we process in our Fresh Pork segment through multi-year, market-based supply agreements with independent suppliers, which provide us with a stable supply of high-quality hogs at market-indexed prices. The loss of any one supplier would not materially impact our business or operations.
Raw Materials for Packaged Meats Segment
We source approximately 80% of the raw materials used in our Packaged Meats segment from our Fresh Pork segment. We purchase beef and poultry from other meat processors to supplement our processing requirements. Our third-party pork and beef purchases are made on a spot basis, while our third-party poultry purchases are booked through annual volume commitments.
Although the price of our raw materials fluctuates due to market dynamics, we believe that our supply of raw materials is adequate and generally available from numerous sources. We seek to mitigate higher input costs through productivity improvements in our operations, various procurement strategies and the use of derivative instruments to economically hedge a portion of forecasted future consumption.
Packaging Materials and Ingredients for Fresh Pork and Packaged Meats Segments
We have a centralized procurement function responsible for competitively sourcing packaging and ingredient raw materials from third-party suppliers. We purchase raw materials, including seasonings, sweeteners, cheese and antimicrobials from ingredient suppliers, commodity processors and other food companies located primarily in the U.S. We also purchase packaging materials, including flexible resin-based packaging, corrugated boxes and folding cartons, foam trays and pads, labels and casings, from packaging manufacturers located primarily in the U.S. We purchase the majority of our packaging materials under contracts with pricing formulas based on published raw material indices for the primary components of our packaging, which are typically resin and paperboard.
We purchase most of the seasonings for our Packaged Meats segment from Saratoga Food Specialties, LLC (“Saratoga”). We owned Saratoga until October 2022 when we sold it to Solina Group Holding. Shortly thereafter,
9
we entered into a strategic sourcing purchase agreement with Saratoga pursuant to which we agreed to purchase certain seasonings exclusively from Saratoga. The sourcing agreement expires on October 31, 2025. The prices at which we purchase seasonings are adjusted annually by agreement between us and Saratoga based on market information and operations data. Saratoga has a right of first refusal to supply us with any new seasoning or sauce products we need. We may terminate the exclusivity arrangement or terminate the sourcing agreement entirely if Saratoga does not satisfy certain key performance indicators. We believe that we carry sufficient inventory of finished product and seasonings to overcome an interruption in the supply of seasonings from Saratoga.
Seasonality
Our business is somewhat seasonal in that, traditionally, the periods of higher sales for hams are the holiday seasons such as Easter, Thanksgiving and Christmas, and the periods of higher sales for ribs, smoked sausages and hot dogs are the summer months. We typically build inventories of certain products in anticipation of seasonal demand fluctuations.
In addition, hog prices tend to rise as hog supplies decrease during the summer, and hog prices tend to decline as hog supplies increase during the fall and winter. This tendency is due to lower farrowing performance during the winter and slower animal growth rates during the summer.
Competition
In our business, we participate across the value chain—from farm to finished products. We believe our diverse branded and private label product offerings allow us to compete effectively across channels and customer price points.
Our ability to compete effectively depends on our capacity to execute across the following primary competitive factors:
•taste;
•product quality;
•nutritional profile and dietary attributes;
•product availability;
•convenience;
•price;
•brand recognition and loyalty; and
•the ability to identify and satisfy emerging consumer preferences.
The protein industry is highly competitive. Competing large, multi-brand consumer packaged food companies include Tyson Foods, Hormel Foods, Kraft Heinz, Pilgrims Pride, Maple Leaf Foods, Premium Brands and Conagra. These competitors are scaled, multinational corporations with substantial financial, marketing, research and development and other resources. Private, category-focused companies that we compete with include Boar’s Head and Johnsonville. These private competitors may be more innovative and able to bring new products to market faster and more quickly exploit and serve niche markets or new or burgeoning consumer preferences. Pork processing companies with which we compete include Tyson Foods, Triumph Foods, JBS USA, Prestage Farms and Seaboard. Although pork is relatively inexpensive in comparison to other protein sources, we also compete indirectly with the producers of chicken, beef, seafood and meat alternatives since changes in the relative prices of these proteins may alter consumer buying patterns. Additionally, we face competition for export sales from both domestic and international suppliers.
As a leading food company, we believe that we effectively compete through our high-quality products, leading brands, expansive channel reach, scaled distribution network, our significant focus on controlling our input costs
10
(including through internally sourced hogs) and our strong financial profile. Based on the strength of our longstanding relationships and proven, execution-oriented management team, we believe that we are a trusted partner to farmers, suppliers, customers and ultimate consumers across the value chain.
Research and Development
We conduct research and development activities to develop new and improved products for our customers, incorporate innovative ingredients, develop advanced pork processing equipment and methods and enhance the survival, health, growth and well-being of our animals.
Our in-house food science research and development team consists of approximately 35 professionals focused on developing new and improved products and enhancing plant productivity. In 2011, we opened Smithfield’s Innovation Center near our headquarters in Smithfield, Virginia. This technologically advanced facility is dedicated to developing new products, enhancing food safety and quality, exploring consumer insights and preferences and evaluating both our products and those of our competitors.
Our animal scientists conduct research at farms across the country to improve the performance and well-being of our animals. In addition, we conduct genetic and genomic research to advance the proprietary genetics of our animals and foster specific traits that improve their overall performance.
Human Capital
As of March 13, 2025, we employed approximately 34,000 individuals in the U.S. and approximately 2,500 in Mexico. Approximately 46% of our employees are covered by collective bargaining agreements or are members of labor unions, and approximately 8,000 of our employees are covered by collective bargaining agreements that will expire in 2025. Our corporate culture emphasizes responsibility, operational excellence and innovation at all levels, and consequently encourages input, initiative and new ideas. To attract and retain employees committed to these values, we recognize the importance of training and development, competitive compensation, and an uncompromising commitment to safety.
•We value every person who contributes to our mission, regardless of age, color, disability, family or marital status, gender, national origin, veteran status or any other characteristic protected by applicable laws. We strictly prohibit discrimination, retaliation, all forms of harassment and bullying, and communicate this through our Code of Business Conduct and Ethics, our employee handbooks, standalone corporate policies and annual training on each of these issues. Our SpeakUp! Hotline and our internal dispute resolution process allow us to quickly respond to employee concerns to support our efforts to maintain a harmonious workplace. We have zero tolerance for human rights abuses, including the use of child, forced or compulsory labor.
•We respect our employees’ rights of association and strive to work cooperatively with the unions that represent our workforce.
•We gather and integrate feedback from team members by deploying surveys, suggestion boxes, roundtable meetings, brainstorming sessions and an open-door policy that encourages team members to freely share ideas. We encourage our team members to participate in the problem-solving process through a framework referred to as worker participation and consultation. More than half of our team members offer feedback voluntarily each month through this formal program. Our second annual employee engagement survey, conducted in 2024, yielded a 61% response rate and provided us with important insights into how we can enhance the employee experience.
•We strive to provide competitive compensation packages and to reward high performers. Our annual incentive plan provides an additional payment to our exempt employees based on achievement of company metrics and individual performance. We reward innovation among our employees through an annual competition in which team members who have been the impetus for improvements that led to cost savings or greater efficiency receive cash awards.
11
•We offer our team members and their families a range of benefits, including medical, dental and vision insurance, prescription drug plans, retirement savings, paid vacation and sick time, paid leave, wellness and mental health programs, employee assistance services and other resources to support their health and wellness. Our employee discount program offers discounts and savings in more than 25 categories, including electronics, food and entertainment. Benefits are available to all full-time team members but may vary because of geographic location or collective bargaining agreements.
•We emphasize our team members’ professional development. Tuition assistance and reimbursement is available to team members for a wide range of educational needs, from undergraduate and graduate degrees to GEDs and English language learning. We offer instructor-led training programs on our industry and our business to promote and support the development of the next generation of supervisors and managers. All team members have access to a digital learning platform, offering hundreds of courses with topics ranging from food safety to leadership development. We also extend educational opportunities to team members’ dependents: in 2024, the Smithfield Scholarship Program awarded nearly $800,000 in college scholarships to 126 dependents of team members at 15 schools across eight states.
•Our apprenticeship program, now in its fifth year, provides apprenticeship opportunities to internal and external candidates, high school graduates and military veterans, with the goal of developing the next generation of experienced tradespeople in our industry. Apprentices receive mentorship, classroom learning and mechanics training while earning an associate degree and journeyman certification. Participants are offered free college tuition, salary, certifications and benefits. Currently, 91 U.S. team members across 22 production facilities are active in the program.
•We want our team members to be proud of their part in combating food insecurity and provide opportunities for them to participate in community events benefiting those who are un-housed or at-risk, as well as veterans and their families and first responders.
Workplace Safety
The safety of our team members is paramount, and safety is embedded into our culture. Safety training starts on Day 1 and continues throughout employment. We require strict adherence to our rigorous health and safety policies from every team member and visitor at our facilities. We practice a “stop work authority” policy, which empowers all our team members to halt production, without fear of retribution, if they believe something is unsafe.
We have implemented our Smithfield Injury Prevention System (“SIPS”), a comprehensive management system that outlines our safety and health policy requirements and includes rigorous validation of the management process. This validation process promotes compliance with SIPS, safeguarding team members and visitors at our facilities. This comprehensive safety program has enabled Smithfield to obtain an International Standards Organization (“ISO”) certification.
Adherence to local, state and federal regulatory compliance is critical for protecting our team, visitors and assets. SIPS is designed to provide the guidance needed to comply with regulatory standards, prevent injuries, manage risks and promote continuous improvement throughout our business. Performance is measured through various metrics, including internal improvement goals and external benchmarks, such as the annual U.S. Bureau of Labor Statistics Report.
Intellectual Property
We rely on a combination of intellectual property laws, internal procedures and policies and contractual provisions to protect our intellectual property and proprietary rights. We own and use numerous retail and foodservice brands, which are registered trademarks or are otherwise protected under applicable intellectual property laws, including, for example: Smithfield, Eckrich, Farmland, Armour, Farmer John, Kretschmar, John Morrell, Cook’s, Gwaltney, Carando, Margherita, Curly’s and Smithfield Culinary. Altosano sells branded products in Mexico under the Altosano brand. We pursue the registration of certain of our trademarks in the U.S. and in certain locations outside the U.S. to protect our brand names, products, and services around the world. Trademark registrations can generally be renewed as long as the trademarks are in use.
12
In December 2012, we entered into a license agreement with Nathan’s Famous. The agreement expires in March 2032. The agreement provides us with the exclusive right to: (1) manufacture, distribute, market and sell “Nathan’s Famous” branded hot dogs, sausages and corned beef and certain other products within the U.S., Canada and Sam’s Clubs in Mexico; and (2) manufacture and distribute “Nathan’s Famous” branded hot dog and sausage products in bulk for use in the food service industry.
We believe that registered and licensed trademarks have been important to the success of our branded fresh pork and packaged meats products. We consider these marks and the accompanying goodwill and customer recognition valuable and material to our business. Our brands are among the leaders across several of the largest packaged meats product categories in the U.S.
In our hog production operations, we use genetic lines of breeding stock that we own, which are considered trade secrets, as well as genetic lines that we license from third parties. We also sublicense rights to some of our strategic hog production partners.
Sustainability
Smithfield was an early mover in sustainability. Over two decades ago, we published our first sustainability report and announced a sustainability framework. Our sustainability strategy continues to evolve. The overarching objective is to show that we are making food responsibly – that we manage and reduce our environmental impacts, that we care for our animals, that we maintain a safe work environment, and that we make good, safe, nutritious and affordable food. We look at sustainability in relation to the value it creates for our company and key stakeholders such as our shareholders and customers. That value ranges from financial benefits like cost savings and innovation to goodwill created with our customers, team members and communities. Most recently, we emphasized the enhancement of our governance principles and management practices as well as the transition of many of our targets and commitments to better reflect optimizations in our operational footprint, performance calculation methodologies and business objectives.
We continue to reference standards and best practices outlined by globally recognized reporting frameworks including the Global Reporting Initiative, the Sustainability Accounting Standards Board Standards under the International Financial Reporting Standards and the United Nations Sustainable Development Goals to inform our strategy, and are guided by the sustainability priorities identified with input from key stakeholders as well as internal monitoring and analysis of sustainability trends, research and regulations. We focus on measurable progress year after year, guided by authentic practices and a culture of continuous improvement.
Respect for our animals, people, the environment and communities is at the core of how we operate. Since our inception, we have been committed to providing good food and dedicated to animal care, community support, employee safety, environmental stewardship and food safety and quality programs. More than 20 years ago, we started to develop a comprehensive animal care management system on our farms. We were also an early industry mover in group housing for confirmed pregnant sows on company-owned farms. To reduce our impact on the environment, we have invested in biogas joint ventures that capture and utilize methane produced on certain company-owned and contract farms as a renewable source of energy. We hold a one-third interest in Monarch Bio Energy, LLC (“Monarch”), a joint venture that currently operates renewable natural gas (“RNG”), projects at nine of our company-owned farms in Missouri. In 2022, TPG Rise Climate invested in Monarch, helping us to further scale the business. We also hold a 50% interest in Align RNG, LLC (“Align”), a joint venture that is developing RNG projects on six of our company-owned farms and contract farms in North Carolina and Virginia.
The development and support of the communities where our employees live and work is a core value and component of our sustainability program. Over the last ten years, we have contributed more than $320 million in cash and in-kind donations to fight hunger, advance education and support the vitality of our local communities.
Quality Assurance and Food Safety
Producing safe, wholesome products for our customers and ultimate consumers is our focus, and we operate under programs and policies that promote regulatory compliance and food safety and quality at every step of our value chain.
13
Regulation
We are subject to extensive food safety regulation, including the Federal Meat Inspection Act of 1906, the U.S. Packers and Stockyards Act of 1921, the Food, Drug and Cosmetic Act of 1938, the Nutrition Labeling and Education Act of 1990, the USDA Pathogen Reduction: Hazard Analysis and Critical Control Point Systems Rule of 1996, the Public Health Security and Bioterrorism Preparedness & Response Act of 2002, the Food Safety Modernization Act of 2011 and other rules and regulations promulgated by the U.S. Food and Drug Administration (“FDA”), the USDA and the sub-branches of these regulatory bodies relating to the production and introduction of human foods to commerce. These comprehensive and evolving regulatory programs govern, among other things, the manufacturing, composition, ingredients, labeling, packaging and safety of food, including compliance with specific current good manufacturing practice regulations.
Our processing plants are subject to on-site examination, inspection and regulation by the USDA. The FDA inspects various of our processing plants that produce snacking foods, heparin products, and pet food and treats in the U.S., as well as the production of our feed mills. We are subject to recalls of our meat products in the event of suspected contamination or adulteration that could constitute a food safety hazard. We maintain a rigorous program of interventions, inspections and testing to reduce the likelihood of food safety hazards.
Compliance with federal, state and local regulation is costly and time-consuming but remains one of our top priorities. Regulatory enforcement actions for violations of federal, state and local regulations may include seizure and condemnation of products, product recalls, cease and desist orders, injunctions and monetary, civil or criminal penalties.
Policies and Procedures
Our plants, as well as those of our hog suppliers, have all developed quality programs following the standards set in the USDA’s Process Verified Program (“PVP”). Our PVP programs monitor aspects of traceability, country of origin and Transport Quality Assurance status of drivers. In addition, all of our applicable U.S. facilities are certified to a Global Food Safety Initiative (“GFSI”) benchmarked standard, and all of our food safety plans and policies meet the requirements of a GFSI benchmarked standard. We also require our ingredient suppliers to undergo annual food safety audits, the majority of which, to our knowledge, meet the requirements of a GFSI benchmarked standard.
To drive adherence to these programs and policies, we employ data analytics to monitor food safety indicators and take corrective action if necessary. As part of our quality and food safety program, our professionals continuously work with the applicable regulatory agencies, including the USDA’s Food Safety and Inspection Service, the FDA and industry associations on projects aimed at improving food safety and increasing consumer protection to stay informed of emerging issues and improve our quality and food safety program.
Animal Care
We are committed to proper animal care and have a moral and ethical obligation to the humane treatment of animals. We believe our hogs can and should be raised, transported and processed using procedures that are safe and free from cruelty and neglect.
Regulation
We are subject to regulations relating to animal treatment, including the Humane Methods of Slaughter Act of 1978 governing our processing plants. Our processing facilities are subject to regular on-site examination, inspection and regulation by the USDA, and regular internal and third-party audits are conducted throughout the year. We are also subject to state laws governing the care of livestock that is used in certain meat products sold within those states, including California Proposition 12 and Massachusetts Question 3.
We believe that we are in substantial compliance with all applicable laws and regulations relating to the operations of our facilities. In addition to complying with federal laws and regulations pertaining to hog production, we are also required to comply with local municipality (city and county), as well as state regulations, including the registration
14
and licensing of our facilities, enforcement by state health agencies of various state standards and inspection of our facilities.
Policies and Procedures
Our comprehensive, systematic animal care management program to monitor and measure the well-being of our hogs on company-owned and contract farms was developed in consultation with experts in animal behavior and handling. The program guides the proper and humane care of our animals at every stage of their lives, from gestation to transport to our processing plants. All farm employees and contract farmers are required to employ the methods and techniques of the management system and verify their compliance.
Our Animal Care Policy underscores our commitments to provide:
•shelter that is designed, maintained and operated to meet the animals’ needs;
•access to adequate water and high-quality feed to meet nutritional requirements;
•humane treatment of animals that enhances their well-being and complies with all applicable laws and regulations;
•identification and appropriate treatment of animals in need of health care; and
•use of humane methods to euthanize sick or injured animals not responding to care and treatment.
Biosecurity, or procedures to prevent the spread of disease to our farms, is a critical element of our program to safeguard the health and well-being of our animals. Our standard operating procedure covers the animal production process at individual farms, as well as the movement of vehicles, animals, personnel and equipment between farms. For example, employees and visitors must “shower in” and change into clean clothing before entering all sow farms and must also “shower out” prior to leaving. In addition, equipment and supplies delivered to sow farms, as well as vehicles, must be disinfected prior to being allowed inside the farm complex.
Since 2009, all company-owned and contract farms have been certified by the National Pork Board’s Pork Quality Assurance Plus (“PQA Plus®”) program that are conducted every three years. Our company-owned and contract farms undergo on-farm site assessments every other year and are subject to random third-party audits.
In December 2017, we completed a 10-year program to phase out individual gestation stalls at our company-owned sow farms and replace the gestation stalls with group pens for all pregnant sows at our U.S. company-owned farms. We offered incentives to contract sow growers to convert to group housing and Altosano has also completed its conversion to group housing facilities for our Mexican hog production operations.
Other Regulation
In addition to the various laws and regulations described above related to quality and food safety and animal care, we are subject to various laws and regulations administered by federal, state and other government entities in the U.S. and internationally, governing, among other things, environmental protection, worker safety, and storage and transportation of our products, including governmental regulations issued by the U.S. Environmental Protection Agency (“EPA”), U.S. Occupational Safety and Health Administration (“OSHA”), the Center for Disease Control and the state and local regulatory authorities relating to handling and discharge of waste water, storm water, air emissions, treatment, storage and disposal of agricultural and food processing wastes, handling of hazardous substances, remediation of contaminated soil, surface water and groundwater, the use and maintenance of refrigeration systems, including ammonia-based chillers, noise, odor and dust management, the operation of mechanized processing equipment and other operations.
Hog production facilities generate significant quantities of manure, which must be managed properly to protect public health and the environment. We track the best technologies available and economically feasible for the management of swine manure, which require permits under state law and, in some instances, federal law. These permits impose standards and conditions on the design and operation of the systems to protect public health and the
15
environment and can also impose nutrient management planning requirements depending on the type of system utilized. In addition, our hog production facilities have been designed to meet or exceed all applicable zoning and other government regulations. These regulations require, among other things, maintenance of separation distances between farms and nearby residences, schools, churches, public use areas, businesses, rivers, streams and wells and adherence to required construction standards. New or more stringent environmental laws or regulations that impose additional requirements on our operations or on us could increase the cost of doing business for us. For more information regarding environmental regulation of our operations, see “Risk Factors—Risks Relating to Government Regulations—Governmental authorities may take further action restricting our ability to produce and/or sell livestock or adopt new regulations impacting our production or processing operations, which could adversely affect our business.”
We follow a number of other policies and protocols to reduce the impact of our hog production operations on the environment, including:
•the employment of environmental management systems;
•ongoing employee training regarding environmental controls;
•walk-around inspections at all sites by trained personnel;
•formal emergency response plans that are regularly updated; and
•collaboration with manufacturers regarding testing and developing new equipment.
Our Mexican operations also are subject to regulation by Mexican environmental authorities. The Mexican federal, state and local authorities may, from time to time, adopt revisions to environmental rules and regulations, and/or changes in the terms and conditions of our environmental permits, with which we must comply. Our Mexican processing plants are also subject to on-site examination, inspection and regulation by Mexican governmental agencies that perform functions similar to those performed by the USDA and the FDA. We believe that we are in substantial compliance with all applicable laws and regulations relating to the operations of our facilities. For more information regarding our Mexican operations, see “Item 1A. Risk Factors—Risks Relating to Our Business and Operations—We are subject to risks associated with our international sales, including disruptions to the worldwide economy due to changes in U.S. trade policy.”
It is our policy to comply with all applicable law in the jurisdictions in which we do business. We believe that we are in substantial compliance with applicable laws and regulations. We use internationally recognized management systems to manage many of our regulatory and compliance programs including, but not limited to, the ISO, 14001:2004 standard to manage and optimize environmental performance. We were the first U.S. livestock and major international meat processor in industry to achieve ISO 14001:2004 certification for our hog production and processing facilities.
Availability of Securities and Exchange Commission (“SEC”) and Corporate Governance Documents
The Company makes available its annual report on Form 10-K, quarterly reports on Form 10-Q, current reports on Form 8-K, and amendments to those reports filed or furnished pursuant to Section 13(a) or 15(d) of the Securities Exchange Act of 1934 on its website at investors.smithfieldfoods.com. These reports are accessible under the caption, “Investors – SEC Filings” on the Company’s website and are available as soon as reasonably practicable after such material is electronically filed with or furnished to the SEC. These filings are also available on the SEC’s website at www.sec.gov. The documents are available in print, free of charge, to any shareholder who requests them.
Cautionary Statements Relevant to Forward-Looking Information
This Annual Report on Form 10-K and our other publicly available documents contain forward-looking statements within the meaning of the safe harbor provisions of the U.S. Private Securities Litigation Reform Act of 1995 about us and our industry that involve substantial risks and uncertainties. All statements other than statements of historical facts contained in this Annual Report on Form 10-K, including statements regarding our strategy, future financial condition, future operations, projected costs, prospects, plans, objectives of management, and expected market
16
growth, are forward-looking statements. In some cases, you can identify forward-looking statements because they contain words, such as “may,” “might,” “will,” “shall,” “should,” “expects,” “plans,” “anticipates,” “could,” “intends,” “target,” “projects,” “contemplates,” “believes,” “estimates,” “predicts,” “potential,” “goal,” “objective,” “seeks,” “likely” or “continue” or the negative of these words or other similar terms or expressions that concern our expectations, strategy, plans, or intentions.
Forward-looking statements contained in this Annual Report on Form 10-K include, but are not limited to, statements about:
•our ability to capture synergies between our Packaged Meats and Fresh Pork segments;
•our ability to execute on our strategy to optimize the size of our hog production operations;
•our ability to anticipate and meet consumer trends and interests through product innovation;
•the size of our addressable markets, market share and market trends, including our ability to drive organic growth in our business through our Packaged Meats and Fresh Pork segments;
•anticipated trends, developments and challenges in our industry, business and the highly competitive markets in which we operate;
•our ability to mitigate higher input costs through productivity improvements in our operations (including analytics and task automation), various procurement strategies and the use of derivative instruments;
•our dependence on third-party suppliers and our ability to mitigate any disruption or inefficiency in our supply chain and/or operations;
•our expectations regarding our hog production transformation strategy and our ability to achieve segment production targets;
•fluctuations in our quarterly results of operations due to the seasonal nature of our business;
•our ability to attract and retain employees and maintain our corporate culture;
•our ability to prevent cyberattacks, other cyber-incidents, security breaches or other disruptions of our information technology systems;
•our ability to defend litigation brought against us successfully and the sufficiency of our accruals for related contingent losses;
•compliance with laws and regulations, including environmental, cybersecurity and tax laws and regulations, that currently apply or may become applicable to our business both in the United States and Mexico and our expectations regarding various laws and restrictions that relate to our business;
•our ability to capitalize on export markets;
•our ability to execute on acquisitions, joint ventures and divestitures;
•legal, regulatory, or market measures to address climate change and our ability to achieve our climate-related goals and strategies;
•future investments in our business, our anticipated capital expenditures and our estimates regarding our capital requirements;
•the sufficiency of our cash and cash equivalents and the availability of our committed credit facilities to meet our liquidity needs;
•our ability to achieve our financial and operational targets;
17
•our ability to maintain our investment grade ratings;
•our expectations regarding expenses, such as stock-based compensation expenses;
•fluctuations in the values of our open derivative contracts and pension obligations and related assets;
•impairment in the carrying value of our goodwill or intangible assets;
•our ability to achieve or maintain our targeted Ratio of Net Debt to Adjusted EBITDA and minimum liquidity levels; and
•our dividend policy and our ability to pay dividends.
We cannot guarantee that the future results, levels of activity, performance or events and circumstances reflected in the forward-looking statements will be achieved or occur at all. The outcome of the events described in these forward-looking statements is subject to risks, uncertainties and other factors, including those described in the section titled “Risk Factors” and elsewhere in this Annual Report on Form 10-K. Moreover, new risks and uncertainties emerge from time to time, and it is not possible for us to predict all risks and uncertainties that could have an impact on the forward-looking statements contained in this Annual Report on Form 10-K.
The forward-looking statements made in this Annual Report on Form 10-K relate only to events as of the date on which the statements are made. We undertake no obligation to update any forward-looking statements made in this Annual Report on Form 10-K to reflect events or circumstances after the date of this Annual Report on Form 10-K or to reflect new information or the occurrence of unanticipated events, except as required by law.
18
ITEM 1A. RISK FACTORS
The following risk factors and other information included in this Annual Report on Form 10-K should be carefully considered. The occurrence of any of the following risks or of unknown risks and uncertainties may adversely affect our business, operating results and financial condition.
Risk Factor Summary
This risk factor summary contains a high-level summary of risks associated with our business. It does not contain all of the information that may be important to you, and you should read this risk factor summary together with the more detailed discussion of risks and uncertainties set forth following this summary. A summary of our risks includes, but is not limited to, the following:
•Our results of operations are cyclical and could be adversely affected by fluctuations in the commodity prices for meat, livestock (primarily hogs) and feed ingredients.
•Disruption of our supply chain could adversely affect our business, financial condition and results of operations.
•An inability to realize savings and efficiency gains could adversely affect profitability and we may be unable to achieve any or all of our financial and operational targets.
•The food industry in which we operate is highly competitive, and our inability to compete successfully, or the effects of such competition, could adversely affect our business, financial condition and results of operations.
•Changes in consumer preferences and failure to maintain favorable consumer perception of our brands and products could negatively impact our business.
•Outbreaks of disease among or attributed to livestock can significantly affect production, the supply of raw materials, demand for our products and our business.
•Our operations are subject to the general risks associated with the food industry, including perceived or real health risks related to our products or the food industry generally and risks associated with government regulations.
•Product liability claims or product recalls can adversely affect our business reputation, expose us to increased scrutiny by federal and state regulators and may not be covered by insurance.
•Any disruption of operations at one or more of our production facilities, distribution centers or cold storage facilities, including as a result of natural disasters, public health crises, political crises and instability, civil unrest and other catastrophic events or events outside of our control, could adversely affect our business, financial condition and results of operations.
•Our reliance on third-party service providers can have an adverse effect on our business.
•Due to seasonality or changes in our promotional activities, our revenue and operating results may vary from quarter to quarter.
•Significant increases in the cost of distribution could adversely affect our business, financial condition and results of operations.
•We are increasingly dependent on information technology, and our business and reputation could suffer if we are unable to protect our information technology systems against, or effectively respond to, cyberattacks, other cyber-incidents or security breaches or if our information technology systems are otherwise disrupted.
19
•Our operations are subject to the risks associated with acquisitions, investments in joint ventures and divestitures.
•We are subject to risks associated with our international sales, including disruptions to the worldwide economy due to changes in U.S. trade policy.
•We depend on availability of, and satisfactory relations with, our employees.
•We are subject to various risks relating to worker employment and health and safety.
•We depend upon the continued services of certain key members of our senior management team, without whom our business operations could be significantly disrupted.
•The consolidation of customers and/or the loss of our customers could adversely impact our business.
•Impairment in the carrying value of goodwill or intangible assets could negatively impact our consolidated results of operations and net worth.
•The loss of any trademark or other intellectual property right could enable other companies to compete more effectively with us.
•Deterioration of economic conditions could negatively impact our business.
•If tax laws change or we experience adverse outcomes resulting from examination of our tax returns or disagreements with taxing authorities, it could adversely affect our business, financial condition and results of operations.
•We face risks associated with the long-term trend toward increased activism against companies in the food products industry.
•We are subject to extensive governmental regulations, which require significant compliance expenditures.
•Governmental authorities may take further action restricting our ability to produce and/or sell livestock or adopt new regulations impacting our production or processing operations, which could adversely affect our business.
•We are, and could become, subject to legal proceedings and regulatory investigations that may result in significant expenses, fines and reputational damage.
•Government antitrust and foreign investment policies and regulations may limit our strategic growth opportunities, including certain acquisitions and joint ventures.
•Environmental regulation and related litigation and commitments could have a material adverse effect on us.
•Climate change, or legal, regulatory, voluntary or market measures to address climate change, may negatively affect our business, operations or reputation.
•We are a “controlled company” within the meaning of the rules of Nasdaq and, as a result rely on exemptions from certain corporate governance requirements. You will not have the same protections afforded to shareholders of other companies that are subject to such requirements.
20
Risks Relating to Our Business and Operations
Our results of operations are cyclical and could be adversely affected by fluctuations in the commodity prices for meat, livestock (primarily hogs) and feed ingredients.
We are significantly impacted by the cyclical nature of commodity prices for meat, livestock (primarily hogs) and feed ingredients such as grains, as well as the selling price of our products and competing animal protein products on the market (especially beef and chicken), all of which are determined by constantly changing and volatile market forces of supply and demand. These fluctuations can be significant, as shown in recent years, with average lean hog prices published by the Chicago Mercantile Exchange, Inc. (“CME”), decreasing from $98 per hundredweight in fiscal year 2022 to $81 per hundredweight in fiscal year 2023 and then increasing to $85 per hundredweight in fiscal year 2024. Further, hog raising costs are largely dependent on the fluctuations of commodity prices for corn, grains, soybean meal, wheat and other feed ingredients. Our Hog Production segment generally generates higher profits when hog prices are high and feed ingredient prices are low, and lower profits (or losses) when hog prices are low and feed ingredient prices are high. When hog prices are lower than our hog production costs, our non-vertically integrated competitors (i.e., those without significant hog production operations) may have a cost advantage over us.
Other factors that may impact commodity prices and our results of operations include, but are not limited to:
•competing demand for feed ingredients, such as competing demand for corn for use in the manufacture of ethanol or other alternative fuels;
•environmental regulations;
•changes in governmental agricultural programs;
•tariffs and other import and export restrictions, such as trade barriers resulting from, among other things, developments in international relations and food safety concerns;
•transportation interruptions or increases in diesel fuel costs;
•an increase in pork processing capacity, adversely impacting fresh meat values;
•adverse weather conditions, including the impact of climate change and weather on our water supply and the availability and pricing of feed ingredients;
•energy prices, including the effect of changes in energy prices on our transportation costs and the cost of feed;
•contamination with mold or bacteria;
•the impact of COVID-19 pandemic and other similar disruptions in the future; and
•labor strikes, industrial accidents, occupational health and safety issues and animal welfare or food safety issues (including the real or perceived outbreak of food-borne illnesses or outbreaks of diseases among livestock).
Profitability in our industry is materially affected by the commodity prices of animal feed ingredients, such as grain, corn and soybean meal and wheat. The production of feed ingredients is positively or negatively affected due to various factors, primarily by the global level of supply inventories and demand for feed ingredients, the agricultural policies of the U.S. and other countries and weather patterns and climatic conditions throughout the world. Market prices for feed ingredients remain volatile. High prices for animal feed ingredients may have a material adverse effect on our operating results. A significant decrease in pork prices for a sustained period of time could have a material adverse effect on our consolidated sales.
Given the volatility of the commodity prices, we have sought to reduce our reliance and exposure to commodity markets by entering into supply contracts that offer price and supply stability and implementing cost-saving programs to offset rising commodity costs. For example, we have been reducing the number of hogs we own and
21
raise and increasing the number of hogs we purchase from contract farmers under market agreements. However, if we are not able to continue to execute and maintain marketing and purchasing contracts with independent growers or supply contracts with our contract farmers on attractive terms, or if our counterparties are unable to perform their obligations under such agreements, our results of operations would be negatively affected.
We attempt to manage certain of these risks through the use of our risk management and hedging programs. However, we may not be effective in doing so and, in any case, these programs may also limit our ability to realize gains from favorable commodity fluctuations. Additionally, a portion of our commodity derivative contracts are marked-to-market, such that the unrealized gains and losses are reported in earnings as incurred. This accounting treatment may cause significant volatility in our earnings. See “Item 7A. Quantitative and Qualitative Disclosures About Market Risk” and “Note 8: Derivative Financial Instruments” to the consolidated financial statements included in Part II, Item 8 of this Annual Report for the effects of derivative instruments on our consolidated statements of income.
Furthermore, we may be unable to price our products to cover increased costs. Competitive considerations and customer resistance to price increases may delay or make us unable to adjust our selling prices. To the extent we are unable to either re-engineer or otherwise offset increased costs or are unwilling or unable to build price increases into a higher quoted price or negotiating higher prices, our margins will be negatively affected. Conversely, when raw materials prices decline, we may receive customer pressure to reduce our sales prices.
Disruption of our supply chain could adversely affect our business, financial condition and results of operations.
The primary raw materials used in our business are hogs, fresh pork, raw beef, poultry and animal feed ingredients, including corn, grains, soybean meal and wheat. Disruption to our raw material supply due to adverse weather conditions, climate change, crop conditions, natural disaster, fire, terrorism, pandemic or epidemic, changes in governmental agricultural programs, strikes, import restrictions, transportation interruptions, increases in diesel fuel costs, increases in handling and storage costs, cold chain market fluctuations, contamination with mold or bacteria, the real or perceived outbreak of food-borne illnesses or outbreak of diseases among livestock, water shortage, industrial accidents and other occupational health and safety issues or other events beyond our control could impair, and in some cases have impaired, our ability to produce and sell our products.
In addition, we rely on specific suppliers for the provision of certain ingredients and materials, including sodium for our hogs and sourcing of carbon dioxide. We purchase most of the seasonings for our Packaged Meats segment from a single company, Saratoga, with which we have entered into an exclusivity agreement regarding such seasonings. Saratoga also has a right of first refusal to supply us with any new seasoning or sauce products we need. We believe that we carry sufficient inventory of finished product and seasonings to overcome an interruption in the supply of seasonings from Saratoga; however, this may not be the case if alternate sources are unavailable or inadequate.
Any disruption in supply of ingredients or materials could affect our ongoing operations and our ability to fulfill demand. A disruption in our supply chain may require significant costs and resources to restore and may also force us to buy material at higher prices, which can substantially increase our costs. We may not be able to pass on all or part of the increased costs to customers in the form of price increases, in a timely manner or at all. Even if we are able to increase our selling prices, sustained price increases for our products may lead to sales declines and loss of market share, particularly if our competitors do not increase their prices.
An inability to realize savings and efficiency gains could adversely affect profitability and we may be unable to achieve any or all of our financial and operational targets.
We are currently implementing multiple savings opportunities across the areas of production, procurement, commercial and logistics, which we expect will deliver productivity savings and help us effectively manage margins and profitability. In addition, we have ongoing initiatives to improve profitability and efficiency gains of the Hog Production segment, including genetic transformation, herd health improvements, procurement and nutrition savings.
However, our cost-savings expectations are based upon several assumptions and estimates that are difficult to predict, necessarily speculative in nature and subject to significant business, operational, economic and competitive
22
uncertainties and contingencies. A variety of factors could affect the realization of some or all of the expected cost savings and efficiency gains, including, but not limited to, our anticipated business strategies, our marketing strategies, our product development and licensing strategies, our ability to anticipate and react to business trends, general economic conditions, lack of sustainability in cost savings over time, unexpected costs associated with operating our business and other developments in our industry. The actual results of implementing the various cost savings and efficiency initiatives may differ materially from our current estimates. Moreover, we may not be able to identify or implement further cost savings and efficiency initiatives in the future. In addition, our continued efforts to implement cost savings and efficiency initiatives may divert management attention from the rest of our business and may preclude us from seeking attractive new product opportunities or pursuing other initiatives, any of which may materially and adversely affect our business. We may be unable to achieve or improve all of these cost savings and efficiency gains within the expected timeframe, or at all, and we may incur additional or unexpected costs in order to realize them.
The food industry in which we operate is highly competitive, and our inability to compete successfully, or the effects of such competition, could adversely affect our business, financial condition and results of operations.
The food industry in which we operate is highly competitive. Numerous brands and products compete for shelf space and sales, with competition in our Packaged Meats and Fresh Pork segments based primarily on taste, product quality, nutritional profile and dietary attributes, product availability, convenience, price, brand recognition and loyalty and the ability to identify and satisfy emerging consumer preferences. Our ability to compete effectively depends on our capacity to execute across these criteria.
Although we regularly conduct research and development activities to develop new products that meet our standards for quality and appeal to consumer preferences, the success of our innovation and product development efforts is affected by our ability to anticipate changes in consumer preferences, the technical capability of our employees in developing and testing product prototypes, our ability to comply with applicable governmental regulations, and the success of our management, sales and marketing teams in introducing and marketing new products, including through current and new product categories.
The protein industry is highly competitive. We compete with large multi-brand packaged foods businesses, as well as fresh meat companies, private, category-focused companies and pork processing companies. Our products compete with many other protein sources, including chicken, beef and seafood, but our principal competition comes from other pork processors. Additionally, we face competition for export sales from both domestic and international suppliers.
Some of our competitors have greater scale, marketing resources, name recognition, research and development capabilities and/or other resources (financial and otherwise) than we do, and some of the companies may be more innovative and able to bring new products to market faster and more quickly exploit and serve niche markets or new or burgeoning consumer preferences than us.
There can be no assurance that we will successfully develop and market new products or successfully introduce products in new categories. The development and introduction of new products requires substantial marketing expenditures, which we may be unable to recoup if the new products do not gain widespread market acceptance. If we introduce new or improved products that ultimately do not meet objectives for such products, it could impact our growth, sales and profitability. Any failure to successfully develop, market and launch future products or successfully enter into new product categories may lead to decreased growth, sales and profitability.
Further, our competitors could increase their promotional spending or market and sell their products more successfully than we do. Our competitors could also offer lower prices to customers, which could pressure us to lower prices to our customers and to achieve additional cost savings to offset these reductions. We may be unable to change our cost structure and pricing practices rapidly enough or sufficiently to successfully compete in such an environment.
We may be unable to compete successfully with any or all of these companies. Competitive pressures or other factors could cause us to lose sales, which may require us to lower prices, increase the use of discounting or
23
promotional programs, or increase marketing expenditures, each of which would adversely affect our margins and could result in a decrease in our operating results and profitability.
Changes in consumer preferences and failure to maintain favorable consumer perception of our brands and products could negatively impact our business.
The food industry in general is subject to changing consumer trends, demands and preferences. Trends within the food industry change often, and failure to identify and react to changes in these trends could lead to, among other things, reduced demand and price reductions for our brands and products. We strive to respond to consumer preferences and social expectations, but we may not be successful in our efforts.
We have a number of widely recognized brands with significant value. Maintaining and continually enhancing the value of these brands is critical to the success of our business. Brand value is based in large part on consumer perceptions. Success in promoting and enhancing brand value depends in large part on our ability to provide high-quality products. Brand value could diminish significantly due to a number of factors, including consumer perception that we have acted in an irresponsible manner, adverse publicity about our products (whether or not valid), our failure to maintain the safety and quality of our food products or ingredients (or the food safety system generally), the failure of our products to deliver consistently positive consumer experiences or the products becoming unavailable to consumers.
Prolonged negative perceptions concerning the health implications of certain food products or ingredients or loss of confidence in the food safety system generally could influence consumer preferences and acceptance of our products and marketing programs. Prolonged negative perceptions and failure to satisfy consumer preferences could materially and adversely affect our business, financial condition and results of operations.
The use of social and digital media by consumers has greatly increased the speed and extent that information or misinformation can be shared. Individuals and organizations have in the past used social media platforms to publicize information and perceptions about the food production industry in general and our company in particular. Such publications could damage our reputation. A negative perception by consumers of one or more of our brands or a shift in consumer preferences away from animal-based products may result in reduced sales of our products, which could have a material adverse effect on our business, results of operations and financial condition.
Outbreaks of disease among or attributed to livestock can significantly affect production, the supply of raw materials, demand for our products and our business.
We are subject to risks relating to our ability to maintain animal health and control diseases. Real or perceived livestock health problems could adversely impact our production, our supply of raw materials and consumer confidence in all of our operating segments.
From time to time, we have experienced outbreaks of livestock diseases, and we may experience additional occurrences of livestock disease in the future. For example, there have been recent outbreaks of both high- and low-pathogenic strains of avian influenza in the U.S. The outbreaks of both high- and low-pathogenic strains of avian influenza are a fairly common occurrence in Mexico. Adverse publicity concerning any disease or health concern could also cause customers to lose confidence in the safety and quality of our food products. Outbreaks of disease, including African Swine Fever (“ASF”), Bovine Spongiform Encephalopathy, Foot and Mouth Disease and Highly Pathogenic Avian Influenza (“HPAI”), can have a significant impact on our financial results. In recent years, ASF has impacted hog herds in Asia (including in China), Europe and the Caribbean; and, if an outbreak of ASF were to occur in the U.S., our supply of hogs and pork could be materially impacted. In 2024, HPAI was detected in the U.S. in dairy cattle, wild birds, mammals, and farm workers directly exposed to infected dairy or poultry. The U.S. pork market was significantly impacted by the spreading of Porcine Epidemic Diarrhea Virus in 2014 and Porcine Reproductive and Respiratory Syndrome Virus in 2015, which affected our herds in several regions. The spread of these diseases in the U.S. reduced hog supplies, leading to higher meat prices. In 2015, the hog herds recovered and supply increase yielded lower market prices. Neither of these diseases or the corresponding fluctuations to market prices had a material adverse impact on our financial condition or results of operations. However, we cannot guarantee that the outbreak of any such diseases would not have a material adverse impact on our financial condition or results of operations in the future.
24
The outbreak of such diseases could adversely affect our supply of raw materials, increase the cost of production, reduce the number of livestock offspring produced, hamper the growth of livestock to finished size, result in expensive vaccination programs and require in some cases the destruction of infected livestock, any of which could adversely affect our operating margins. Additionally, the real or perceived outbreak of disease may hinder our ability to market and sell products both domestically and internationally. Any real or perceived outbreak of disease, including contamination of other livestock of our competitors, could also reduce consumer confidence in the meat products affected by the particular disease, generate adverse publicity, depress market conditions for our hogs internationally and/or domestically and result in the imposition of import or export restrictions.
Our operations are subject to the general risks associated with the food industry, including perceived or real health risks related to our products or the food industry generally and risks associated with government regulations.
We are subject to risks affecting the food industry generally, including risks posed by the following:
•food spoilage;
•food contamination;
•food allergens;
•consumer nutritional and health-related concerns;
•consumer product liability claims;
•product tampering;
•product labeling errors;
•the expense and possible unavailability of product liability insurance; and
•the potential cost and disruption of a product recall or withdrawal.
Adverse publicity concerning any perceived or real health risk associated with our brands or our products could cause customers to lose confidence in the safety and quality of our food products, which could adversely affect our reputation, business, financial condition and results of operation, particularly as we expand our branded products business. We could also be adversely affected by perceived or real health risks associated with similar products produced by others to the extent such risks cause customers to lose confidence in the safety and quality of such products generally and, therefore, lead customers to opt for other options that are perceived as safe.
Our manufacturing facilities and products, including the processing, packaging, storage, distribution, advertising and labeling of our products, are subject to extensive federal, state and foreign laws and regulations in the food safety area, including regular government inspections and governmental food processing controls. Loss of or failure to obtain necessary permits and registrations could delay or prevent us from meeting current product demand, introducing new products, building new facilities or acquiring new businesses and could adversely affect operating results. If we are found to be out of compliance with applicable laws and regulations, particularly if it relates to or compromises food safety or animal welfare, we could be subject to civil remedies, including fines, injunctions, recalls or asset seizures, as well as potential criminal sanctions, any of which could have a material adverse effect on our business, financial condition, results of operations and prospects. In addition, future material changes in food safety and animal welfare regulations could result in increased operating costs or could be required to be implemented on schedules that cannot be met without interruptions in our operations.
Product liability claims or product recalls can adversely affect our business reputation, expose us to increased scrutiny by federal and state regulators and may not be covered by insurance.
Pork and poultry products may be subject to contamination by foreign materials, exposure to chemicals of concern from packaging or environmental exposure, or disease-producing organisms or pathogens, such as Listeria
25
monocytogenes, Salmonella, Campylobacter and generic E.coli, Yersinia enterocolitica and Staphylococcus aureus. Because these pathogens are generally found in the environment, there is a risk that, as a result of food processing, they could be present in our products. We cannot assure you that our food safety monitoring systems, even when working effectively, will eliminate all such risks related to food safety. These risks cannot be eliminated entirely even with adherence to good manufacturing practices and finished product testing. We license our brand abroad and have little, if any control, over the products sold under such licenses. Any quality issues with such products could cause reputational damage to us. We also have little, if any, control over proper handling once the product has been shipped. Illness and death may result if the pathogens are not eliminated at the further processing, food service or consumer level. Even an inadvertent shipment of contaminated products is a violation of law and may lead to increased risk of exposure to product liability claims, product recalls and increased scrutiny by federal and state regulatory agencies and may have a material adverse effect on our business, reputation and/or prospects. The packaging, marketing and distribution of food products entail an inherent risk of product liability and product recall and the resultant adverse publicity. We may be subject to significant liability if the consumption of any of our products causes injury, illness or death.
We could be required, and in some instances have in the past been required to, recall certain products due to such products being mislabeled, contaminated, spoiled, tampered with or damaged, whether caused by us or someone in our supply chain. A widespread product recall or market withdrawal could result in significant losses due to the cost of a recall or withdrawal, the destruction of product inventory, potential customer claims, lost sales due to the unavailability of product for a period of time. The costs associated with product recalls could be exacerbated by issues encountered in tracing affected products either within our facilities or in the hands of third parties. In addition, such a product recall or withdrawal could also result in adverse publicity, damage to our reputation and a loss of consumer confidence in our products, which could have a material adverse effect on our business results. Any product contamination or mislabeling also could subject us to, and in some instances has subjected us to, product liability claims, adverse publicity or government scrutiny, investigation or intervention, resulting in increased costs and decreased sales as customers lose confidence in the safety and quality of our food products.
In addition, we purchase ingredients, commodities and other raw materials from third-party suppliers. If these materials are alleged or prove to include contaminants that affect the safety or quality of our products or are otherwise rumored to have adverse effects, we may need to find alternate materials for our products, delay production of our products, or discard or otherwise dispose of our products, which could adversely affect our results of operations. Additionally, if this occurs after the affected product has been distributed, we may need to withdraw or recall the affected product and we may experience adverse publicity or product liability claims. We cannot assure you that we will not be required to perform product recalls, or that product liability claims will not be asserted against us, in the future. Any claims that may be made may create adverse publicity that would have a material adverse effect on our ability to market our products successfully or on our business, reputation, prospects, financial condition and results of operations.
Moreover, claims or liabilities of this type might not be covered by our insurance or by any rights of indemnity or contribution that we may have against others. We do not currently maintain any product recall insurance and we cannot be sure that we will not incur claims or liabilities for which we are not insured or that exceed the amount of our insurance coverage. A product liability judgment against us or a widespread product recall could have a material adverse effect on our business, financial condition, results of operations or liquidity. To date, product recalls have not had a material adverse impact on our financial condition or results of operations.
Any disruption of operations at one or more of our production facilities, distribution centers or cold storage facilities, including as a result of natural disasters, public health crises, political crises and instability, civil unrest and other catastrophic events or events outside of our control, could adversely affect our business, financial condition and results of operations.
Our production and distribution network consists of numerous processing plants and distribution centers that are either company-owned or rented, and numerous third-party cold storage facilities in North America. Any disruption in, or the loss of operations at, one or more of these facilities, even on a short-term basis, could delay or postpone production or distribution of our products, which could adversely affect our business, financial condition and results of operations.
26
Natural disasters, such as fires, earthquakes, power shortages or outages, floods or monsoons, public health crises, such as pandemics and epidemics, political crises, such as terrorism, war, civil unrest, political instability or other conflict, or other events outside of our control have in the past, and may in the future, adversely impact our results of operations.
Such disruption could be caused by a number of different events, including:
•maintenance outages;
•regulatory actions;
•prolonged power failures;
•equipment or software failure;
•widespread contamination of our equipment;
•fires, floods, earthquakes or other natural disasters; or
•other events beyond our control.
Any material malfunction or prolonged disruption in the operations of any of our facilities, including our manufacturing facilities, farms, distribution facilities, stores of our wholesale partners or the facilities of our suppliers, distributors or any of our other third-party service providers, could prevent us from fulfilling orders to existing customers and could limit our ability to sell products to new customers. Any of these events could adversely affect our business, financial condition and results of operations.
A meaningful portion of our packaged meat and fresh pork products are distributed through our facility in Kansas and disruption to operations at this facility would require us to change our overall distribution activities which would likely have an adverse impact on our operations. We also utilize third-party warehouse and transportation providers through which a meaningful portion of our product is distributed. A disruption in storage or transportation services could be caused by a number of factors, including:
•labor issues;
•port and shipping capacity;
•failure to meet customer standards;
•acts of war;
•terrorism;
•fire, earthquakes, extreme temperatures, flooding or other natural disasters; or
•bankruptcy or other financial issues affecting the third-party providers of such services.
A disruption in storage or transportation services could result in an inability to supply materials to our facilities or finished products to our distribution centers or customers. Alternatives may not be available on short notice or could result in higher transportation costs. Any disruption in the distribution chain of our products or an increase in the cost of these services could have a material adverse effect on our business, financial condition and results of operations.
Our reliance on third-party service providers can have an adverse effect on our business.
We rely on third-party service providers for many areas of our business, including transportation and cold storage. Failure by these third parties, including independent growers, to meet their contractual, regulatory and other obligations to us, or our failure to adequately monitor their performance, have in the past resulted in and could in the future result in additional costs to remediate errors made by such service providers. Depending on the function
27
involved, such errors have in the past led to and can in the future lead to business disruption, systems performance degradation, processing inefficiencies or other systems disruptions, the loss of or damage to intellectual property or sensitive data through security breaches or otherwise, incorrect or adverse effects on financial reporting, litigation or remediation costs, damage to our reputation, all of which can adversely affect our business. For example, should the refrigeration system fail at one of our third-party cold storage facilities, we could suffer the loss of some, or all, of our inventory. Should our contract manufacturers go out of business or suffer major equipment failure, we may lose the ability to produce sufficient quantities of our products for a period of time before establishing production with a new manufacturer. Any number of similar failures suffered by our service providers could prove damaging to our ongoing operations and our ability to fulfill demand.
Due to seasonality or changes in our promotional activities, our revenue and operating results may vary from quarter to quarter.
We have experienced, and expect to continue to experience, fluctuations in our quarterly results of operations due to the seasonal nature of our business. Hog supply and consumer purchasing patterns are impacted by seasonal factors, including weather and holidays. Seasonality could cause our results of operations for an interim financial period to fluctuate and not be indicative of our full-year results. Seasonality also impacts relative net sales and profitability of each quarter of the year, both on a quarter-to-quarter and year-over-year basis. If we fail to effectively manage our inventories or fluctuations in business as a result of promotional activities or other factors, seasonality could have a material adverse effect on our business, financial condition and results of operations.
Significant increases in the cost of distribution could adversely affect our business, financial condition and results of operations.
Our distribution costs primarily include freight and cold storage. Significant increases in these distribution costs could adversely affect our business, financial condition and results of operations. We use a core group of contract carriers that have established rates based on mileage to regions or destination states. A fuel surcharge addendum is a component of all rates to offset the fluctuating price of diesel fuel, primarily to limit the contract carrier’s exposure. If these surcharges rise significantly and we do not have effective hedges in place, or if we are unable to pass increased distribution costs on to our customers in the form of higher prices for our products, our business, financial condition and operating results could be adversely affected. In addition, if we increase prices to offset higher transportation and distribution costs, we could experience lower demand for our products, decreased ability to attract new customers and lower sales volumes.
We use in-house and third-party cold storage vendors to store our finished goods. A major component of cold storage operations expense is electricity cost. Any significant increase in electricity rates for the vendor are passed along to us in the form of higher storage rates. If our storage rates or electricity rates for in-house cold storage increase significantly, we may be unable to pass these costs on to our customers, which could adversely affect our business, financial condition and results of operations.
We are increasingly dependent on information technology, and our business and reputation could suffer if we are unable to protect our information technology systems against, or effectively respond to, cyberattacks, other cyber-incidents or security breaches or if our information technology systems are otherwise disrupted.
Information technology is an important part of our business operations, and we increasingly rely on information technology systems to manage business data and increase efficiencies in our production and distribution facilities and inventory management processes. We also use information technology to process financial information and results of operations and to comply with regulatory, legal and tax requirements. In addition, we depend on information technology for digital marketing and electronic communications among our facilities, personnel, customers and suppliers. Like other companies, our information technology systems are vulnerable to a variety of disruptions, including, but not limited to, the process of upgrading or replacing software, databases or components thereof, natural disasters, terrorist attacks, telecommunications failures, computer viruses, cyberattacks, hackers, unauthorized access attempts and other security issues. Cyberattacks and other cyber-incidents are occurring more frequently, constantly evolving in nature, becoming more sophisticated and being made by groups and individuals with a wide range of motives and expertise. Our security initiatives and disaster recovery plans to mitigate our
28
exposure to these risks may not be adequate. Any significant failure of our systems, including failures that prevent our systems from functioning as intended or our failure to timely identify or appropriately respond to cyberattacks or other cyber-incidents, could cause transaction errors, processing inefficiencies, loss of customers and sales, have negative consequences on our employees and our business partners, have a negative impact on our operations and business reputation and expose us to liability, litigation and regulatory enforcement actions.
In addition, targeted cyberattacks or those that result from a security incident directed at a third-party vendor that we rely on have in the past created and can in the future create a risk of compromise to our internal systems, products and offerings, which have in the past resulted in and could in the future result in interruptions or delays that could disrupt our business operations. If our supply chain cybersecurity is compromised as a result of third-party action, employee error, malfeasance, stolen or fraudulently obtained log-in credentials or otherwise, our business may be harmed and we could incur significant liabilities. For example, we were informed by the third-party provider for our previously hosted consumer facing website that a security incident occurred on the third-party website hosting provider’s information technology (“IT”) systems in which an unauthorized party obtained certain information about certain of our customers who made purchases on its websites.
The costs to address cybersecurity risks or risks on information technology failure, both before and after an incident, have in the past been and could in the future be significant, regardless of whether incidents result or resulted from an attack on us directly, or on third-party vendors upon which we rely. If we are unable to prevent security breaches, we may suffer financial and reputational damage or penalties because of the unauthorized disclosure of confidential information belonging to us or to our business partners, customers, consumers or suppliers. Finally, the disclosure of non-public information through external media channels could lead to the loss of intellectual property or damage our reputation and brand image. Any such incidents could subject us to government investigations and regulatory enforcement actions, litigation, potential liability, and damage to our brand and reputation or otherwise harm our business and operations.
Our operations are subject to the risks associated with acquisitions, investments in joint ventures and divestitures.
From time to time, we review opportunities for strategic growth through acquisitions. We have also pursued and may in the future pursue strategic growth through investment in joint ventures. These acquisitions and investments may involve large transactions or realignment of existing investments. These transactions present financial, managerial and operational challenges, including:
•diversion of management attention from managing our existing business;
•difficulty with integrating businesses, operations, personnel and financial and other systems;
•lack of experience in operating in the geographical or product markets of the acquired business;
•new or additional regulatory requirements;
•failure to realize any or all of the anticipated benefits, including cost synergies;
•increased levels of debt potentially leading to associated reduction in ratings of our debt securities and adverse impact on our various financial ratios;
•the requirement that we periodically review the value at which we carry our investments in joint ventures and, in the event we determine that the value at which we carry a joint venture investment has been impaired, the requirement to record a non-cash impairment charge, which charge could substantially affect our reported earnings in the period of such charge, would negatively impact our financial ratios and could limit our ability to obtain financing in the future;
•potential loss of key employees and customers of the acquired business;
•assumption of and exposure to unknown or contingent liabilities of acquired businesses;
•potential disputes with the sellers; and
29
•for our investments, potential lack of common business goals and strategies with, and cooperation of, our joint venture partners.
Product sales and our manufacturing facilities are subject to USDA and FDA regulation in the U.S. and comparable regulatory requirements outside the U.S. Failure to satisfy such regulatory requirements may impact our ability to manufacture and sell such products or may subject us to regulatory or judicial enforcement actions that could be costly and time consuming and could divert the attention of management, as well as negatively impact our reputation and brand. We may experience financial or other setbacks if any of the businesses that we have acquired or may acquire in the future have problems of which we are not aware or liabilities that exceed expectations.
Additionally, from time to time, we may divest businesses that do not meet our strategic objectives or do not meet our growth or profitability targets. We may not be able to complete desired or proposed divestitures on terms favorable to us. Gains or losses from the sales of, or lost operating profit from, those businesses may adversely affect our profitability and margins. Moreover, we may incur asset impairment charges related to divestitures that reduce our profitability. Our divestiture activities may present financial, managerial and operational risks, and could adversely affect our business, financial condition and results of operations.
We are subject to risks associated with our international sales, including disruptions to the worldwide economy due to changes in U.S. trade policy.
We export our products to over 30 countries, and we are engaged in a joint venture in Mexico. For the year ended December 29, 2024, U.S. export sales accounted for 13% of our total sales. Because of the growing market share of U.S. pork products in the international markets, U.S. exporters are increasingly being affected by measures taken by importing countries to protect local producers.
Our international sales and investments operations are subject to various risks related to economic or political uncertainties, including, but not limited to, the following risks:
•general economic and political conditions;
•imposition of tariffs, quotas, trade barriers and other trade protection measures by various countries;
•import or export licensing requirements imposed by various countries;
•the closing of borders by foreign countries to the import of our products due to, among other things, animal disease or other perceived health or safety issues;
•difficulties and costs associated with complying with, and enforcing remedies under, a wide variety of complex domestic and international laws, treaties and regulations, including anti-corruption laws, export controls and sanctions laws and anti-money laundering laws;
•the risk that the parties with which we do business, including parties that may resell our products in foreign countries, may not comply with all applicable laws, treaties and regulations, including import and export licensing requirements, anti-corruption laws (including, but not limited to, the U.S. Foreign Corrupt Practices Act, due to our operations in Mexico), sanctions laws, anti-bribery laws and anti-money laundering laws, and that any such non-compliance may have direct or indirect consequences on us, such as reputational harm and subjecting us to government investigations or penalties;
•different regulatory structures and unexpected changes in regulatory environments;
•tax rates that may exceed those in the U.S. and earnings that may be subject to withholding requirements and incremental taxes upon repatriation;
•potentially negative consequences from changes in tax laws;
•increased distribution costs, disruptions in shipping or reduced availability of freight transportation; and
•disruptions or halts in operations at ports in the U.S.
30
The U.S. has recently signaled its intention to change U.S. trade policy, including potentially renegotiating or terminating existing trade agreements and leveraging tariffs. For example, the current U.S. administration recently announced the implementation of a 25% additional tariff on imports from Canada and Mexico and a 20% additional tariff on imports from China. In response to the U.S. tariffs, China, Canada and Mexico each announced plans to put in place their own tariffs on American products. However, on March 6, 2025, President Trump announced that the proposed tariffs on imported goods from Canada and Mexico that are covered by the United States-Mexico-Canada Agreement will be suspended until April 2, 2025. China has responded by imposing an additional 15% tariff on U.S. chicken, wheat, corn and cotton products and an additional 10% tariff on pork, among other products, increasing the tariff rate on U.S. pork going into China from 37% to 47%.
The U.S. pork industry depends on free and open export markets to support growth. China, Mexico and Canada are three of our largest export markets. Tariffs imposed on U.S. pork exports could increase U.S. pork supplies, which would also affect the price of pork in the U.S. We could also experience a decrease in demand or lose customers due to anti-American sentiment. Any of the above could materially affect our business, financial condition and results of operations.
We cannot predict future trade policy and regulations in the U.S. and other countries, the terms of any renegotiated trade agreements or treaties, or tariffs and their impact on our business. A trade war could have a significant adverse effect on world trade and macroeconomic markets at large. To the extent that trade tariffs and other restrictions imposed by the U.S. or other countries increase the price of, or limit the amount of, our products or raw materials used in our products imported into the U.S. or other countries, or create adverse tax consequences, the sales, cost or gross margin of our products may be adversely affected and the demand from our customers for products may be diminished. Uncertainty surrounding international trade policy and regulations as well as disputes and protectionist measures could also have an adverse effect on consumer confidence and spending.
Furthermore, our foreign operations are subject to the risks described above as well as additional risks and uncertainties including:
•fluctuations in currency values, which have affected, among other things, the costs of our investments in foreign operations;
•translation of foreign currencies into U.S. dollars;
•foreign currency exchange controls; and
•unstable political environments.
Negative consequences relating to these risks and uncertainties could jeopardize or limit our ability to export our products to one or more of those markets and could adversely affect our business, financial condition and results of operations.
We depend on availability of, and satisfactory relations with, our employees.
As of February 28, 2025, we had approximately 34,000 employees in the U.S. and approximately 2,500 in Mexico, with approximately 46% of our total workforce covered by collective bargaining agreements or are members of labor unions. Our operations depend on the availability, retention and relative costs of labor and maintaining satisfactory relations with employees and the labor unions. Further, employee shortages can and do occur, particularly in rural areas where some of our operations are located. Labor relations issues arise from time to time, including issues in connection with union efforts to represent employees at our plants and with the negotiation of new collective bargaining agreements. If we fail to maintain satisfactory relations with our employees or with the labor unions, we may experience labor strikes, work stoppages or other labor disputes. Negotiation of collective bargaining agreements also could result in higher ongoing labor costs.
Immigration reform continues to attract significant attention in the public arena and the U.S. Congress. If new immigration legislation is enacted, such laws may contain provisions that could increase our costs in recruiting, training and retaining employees, increase our costs of complying with federal law in reviewing employees’
31
immigration status and create employee shortages. Furthermore, increased enforcement efforts with respect to existing immigration laws by governmental authorities may disrupt a portion of our workforce or our operations. There can be no assurance that these activities or consequences will not adversely affect our business, financial condition or results of operations in the future.
We also rely on an adequate supply of skilled employees in the farming and corporate areas. Trained and experienced personnel in our industry are in high demand, and we have experienced high turnover and difficulty retaining employees with appropriate training and skills. We cannot predict whether we will be able to attract, motivate and maintain an adequate skilled workforce necessary to operate our existing and future facilities efficiently, or that labor expenses will not increase as a result of a shortage in the supply of skilled personnel, thereby adversely impacting our financial performance. While our industry generally operates with high employee turnover, any material increases in employee turnover rates or any widespread employee dissatisfaction could also have a material adverse effect on our business, financial condition and results of operations.
We are subject to various risks relating to worker employment and health and safety.
Given the nature of our operations, the type of work performed by our employees and the number of plants and employees that we have, we are subject to various risks relating to employment eligibility and worker safety. We cannot assure you that no accidents will occur. Workplace accidents have previously resulted in lawsuits, regulatory or administrative investigations and inquiries and fines and penalties, and we may become subject to additional such lawsuits, investigations and inquiries, and fines and penalties in the future, and our business, financial condition and results of operations may be adversely affected.
Allegations or findings that we, our suppliers, third-party staffing agencies or other business partners are not complying with applicable workplace and labor laws, including child labor laws, or regarding illegal employment of foreign workers, could negatively affect our overall reputation and brand image, which in turn could have a negative impact on our relationships with customers, consumers and our brand license partners, as well as subject us to increased regulatory and political scrutiny. In addition, the discovery by us or governmental authorities of undocumented workers could result in our having to attempt to replace those workers, which could be disruptive to our operations or may be difficult to do. Moreover, failure or perceived failure to comply with legal or regulatory requirements applicable to our business could expose us to litigation, governmental inquiries and substantial fines and penalties, as well as costs and distractions, that could adversely affect our business, results of operations, financial condition and cash flows.
Following a 2023 investigation of our plant in St. James, the Minnesota Department of Labor and Industry alleged that we had employed 11 underage employees during the two-year audit period. During the hiring process, we use the federal E-Verify system and trained human resources professionals to scrutinize identity documents for I-9 purposes carefully, but our process may be circumvented by underage individuals with fake documentation. Since this investigation, we have put in place new risk-based measures designed to recognize identity fraud, including visual inspection protocols, internal auditing and enhanced I-9 training. In November 2024, we entered into a consent order with the Minnesota Department of Labor and Industry relating to these allegations. Although we did not admit liability in connection with this consent order, we paid a $2 million administrative penalty. Under the consent order, we are required to conduct industry outreach related to underage labor compliance, contractually require underage labor compliance with our labor staffing agencies and sanitation contractors, and take other steps to enhance our compliance practices.
In addition, one of our sanitation contractors, Packers Sanitation Services Inc. (now called Fortrex, Inc.), was featured prominently in the news in 2022 and 2023 because of a federal investigation that found underage employees in its workforce. We have sought to address the risk of our contractors utilizing underage employees by increasing our efforts to monitor compliance by these third parties; however, we cannot provide any assurance that companies that provide services to us will comply with such laws and that our monitoring efforts will timely identify non-compliance, if any occurs. In addition, we cannot give any assurance that our reputation will not be adversely affected by non-compliance, governmental investigations or other inquiries in the future.
32
We depend upon the continued services of certain key members of our senior management team, without whom our business operations could be significantly disrupted.
Our success depends, in part, on the continued contributions of our executive leadership team and key members of our senior management. Our management team has significant industry experience, as well as in-depth knowledge of our company, and could be difficult to replace. Any loss or extended interruption in the service of one or more of our senior officers could adversely affect our business, financial condition and results of operations. In addition, we do not have key-man insurance on the life of any of our officers. The unexpected loss of the services of our key personnel could have a detrimental effect on us. Moreover, the market for qualified individuals may be highly competitive and we may not be able to attract and retain qualified personnel to replace or succeed members of our senior management, should the need arise. In addition, our compensation arrangements may not always be successful in attracting new employees or retaining our existing team members.
The consolidation of customers and/or the loss of our customers could adversely impact our business.
Continued consolidation within the retail industry, including among supermarkets, warehouse clubs and food distributors, has resulted in an increasingly concentrated retail base and increased our exposure to loss of certain customers. These consolidations have produced large, sophisticated customers with increased buying power who are more capable of operating with reduced inventories, opposing price increases, and demanding lower pricing, increased promotional programs and specifically tailored products. These customers also may use shelf space currently used for our products for their own private label products. Because of these trends, our volume growth could slow or we may need to lower prices or increase promotional spending for our products, any of which could adversely affect our financial results. Additionally, these large customers may demand more favorable terms that may expose us to greater risks, including uncapped indemnification and no limitation of liability provisions. Such terms may obligate us to pay significant amounts in connection with potential losses arising from claims and related legal proceedings, and any such claims could also affect our reputation and our relationship with customers.
Our ten largest customers represented approximately 38% of net sales of fiscal year 2024. We generally do not have long-term sales agreements or other contractual assurances as to future sales to our customers, including these major customers. Our business could be materially adversely affected and suffer significant decreases in sales and operating profit from the loss of one or more of our larger customers or if our larger customers’ plans, markets, and/or financial condition should change significantly. For example, if our customers cannot access sufficient funds or financing, then they may delay, decrease, or cancel purchases of our products, or delay or fail to pay us for previous purchases. The loss of a significant customer or a material reduction in sales to, or adverse change to trade terms with, a significant customer could materially and adversely affect our product sales, financial condition and results of operations.
Impairment in the carrying value of goodwill or intangible assets could negatively impact our consolidated results of operations and net worth.
As of December 29, 2024, we had $2,879 million of goodwill and intangible assets, which represented approximately 26% of total assets. Goodwill was allocated to our reporting units as follows: Packaged Meats, $1,503 million; Mexico, $69 million; Fresh Pork, $34 million; Hog Production, $4 million; and Bioscience, $4 million. Under accounting principles generally accepted in the U.S. (“GAAP”), goodwill and identified intangible assets with indefinite lives must be evaluated for impairment annually or more frequently if events indicate it is warranted.
Goodwill is the excess amount of purchase consideration over the fair value of net assets acquired in a business combination. In evaluating the potential for impairment of goodwill, we make assumptions regarding future operating performance, business trends, and market and economic conditions. Such analyses further require us to make judgmental assumptions about sales, operating margins, growth rates, and discount rates. There are inherent uncertainties related to these factors and to management’s judgment in applying these factors to the assessment of goodwill recoverability. Goodwill reviews are prepared using estimates of the fair value of reporting units based on market multiples of earnings before interest, taxes, depreciation and amortization (“EBITDA”) and/or on the estimated present value of future cash flows. For indefinite life intangible assets, an impairment loss is recognized if
33
the carrying amount of an indefinite life intangible asset exceeds the estimated fair value of that intangible asset. Identified intangible assets with definite lives are tested for recoverability whenever events or changes in circumstances indicate that their carrying amount may not be recoverable.
Events and conditions that could result in impairment in the value of our goodwill and other intangible assets include changes in the industry in which we operate, particularly the impact of a downturn in the global economy or the economies of geographic regions or countries in which we operate, as well as competition, adverse changes in the regulatory environment, or other factors leading to reduction in expected long-term sales or profitability. We could be required to evaluate the recoverability of goodwill and indefinite life intangible assets prior to the annual assessment if we experience disruptions to the business, unexpected significant declines in operating results, divestiture of a significant component of our business or market capitalization declines.
In addition, our equity investments in joint ventures, partnerships and other entities, both within and outside the U.S., are periodically involved in modifying and amending their credit facilities and loan agreements. The ability of these entities to refinance or amend their facilities on a successful and satisfactory basis, and to comply with the covenants in their financing facilities, affects our assessment of the carrying value of any individual investment. As of December 29, 2024, none of our equity investments represented more than 5% of our total consolidated assets. If we determine in the future that an investment is impaired, we would be required to record a non-cash impairment charge, which could substantially affect our reported earnings in the period of such charge. In addition, any such impairment charge would negatively impact our financial ratios and could limit our ability to obtain financing in the future. See “Note 9: Equity Method Investments” to the consolidated financial statements included in Part II, Item 8 of this Annual Report for a discussion of the accounting treatment of our equity investments.
The loss of any trademark or other intellectual property right could enable other companies to compete more effectively with us.
We utilize intellectual property in our business. Our registered and unregistered trademarks are valuable assets that reflect the goodwill of our brands and consumers’ favorable perception of our products. We have invested a significant amount of money in establishing, promoting and protecting our brands. We also rely on patented and unpatented proprietary methods, processes and techniques in our manufacturing operations and copyright protection in our sales and marketing materials to develop and maintain our competitive position. Our continued success depends, to a significant degree, upon our ability to protect and preserve our intellectual property rights. In certain jurisdictions, we receive access to third-party intellectual property. In particular, we have a license agreement with Nathan’s Famous for the exclusive right to manufacture, distribute, market and sell “Nathan’s Famous” branded hot dogs and sausages in refrigerated consumer packages to be resold through retail channels within the U.S. until March 2032. We cannot assure you that we will be able to maintain or renew the license agreement with Nathan’s Famous or enter into new license agreement with third-party owners of intellectual property on reasonable terms, or at all. We also license certain of our trademarks and other intellectual property for use by third parties. In an effort to preserve our trademark rights, we enter into license agreements with these third parties that govern the use of our trademarks and contain limitations on their use. We cannot assure you that our efforts to police the use of our trademarks by our licensees will be sufficient to ensure that our licensees abide by the terms of their licenses. In the event that our licensees fail to do so, our trademark rights could be diluted.
We rely primarily on confidentiality agreements and intellectual property law to protect our proprietary rights. Our confidentiality agreements with our employees and certain of our consultants, contract employees, suppliers, vendors and independent contractors, including some of our co-manufacturers who use our formulations to manufacture our products, generally require that all non-public information made known to them be kept strictly confidential. Further, some of our formulations have been developed by or with our suppliers and co-manufacturers. As a result, we may not hold exclusive rights to some formulations or be able to prevent others from using similar formulations.
We cannot be certain that the steps we have taken to protect our intellectual property rights are adequate, that our intellectual property rights can be successfully defended and asserted in the future or that third parties will not infringe upon, misappropriate or challenge any such rights. In addition, our trademark rights and related registrations may be challenged in the future and could be canceled or narrowed. Failure to protect our trademark rights could
34
prevent us in the future from using certain brands or from challenging third parties who use names and logos similar to our trademarks, which may in turn cause consumer confusion or negatively affect consumers’ perception of our brands and products. We may not be successful in enforcing our trademarks or challenging confusingly similar trademarks used by third parties. Moreover, intellectual property disputes and proceedings and infringement claims may result in a significant distraction for management and significant expense, which may not be recoverable regardless of whether we are successful. Such proceedings may be protracted with no certainty of success, and an adverse outcome could subject us to liabilities, force us to cease use of certain trademarks or other intellectual property, or force us to enter into licenses with others. Any one of these occurrences may have an adverse effect on our business, financial condition and results of operations.
Deterioration of economic conditions could negatively impact our business.
Our business and results of operations have in the past been and may continue in the future to be adversely affected by changes in national or global economic conditions, including inflation, interest rates, availability of and access to capital markets, volatility in financial markets, declining consumer spending rates, recessions, decreased energy availability and increased energy costs (including fuel surcharges), supply chain challenges, labor shortages, geopolitical conflicts (including the ongoing conflicts between Russia and Ukraine and Israel and Hamas), the negative impacts caused by pandemics, epidemics and public health crises and the effects of governmental initiatives to manage economic conditions.
Any such changes could adversely affect the demand for our products or the cost and availability of our needed raw materials, cooking ingredients and packaging materials, thereby negatively affecting our financial results. Disruptions and instability in credit and other financial markets and deterioration of national and global economic conditions, could, among other things:
•make it more difficult or costly for us to obtain financing for our operations or investments or to refinance our debt in the future;
•cause our lenders to depart from prior credit industry practice and make more difficult or expensive the granting of any technical or other waivers under our credit agreements to the extent we may seek them in the future;
•impair the financial condition of some of our customers, suppliers or counterparties to our derivative instruments, which could result in challenges in collecting accounts receivable or non-performance by suppliers;
•lead customers and consumers to delay or reduce purchases of our products as a result of unfavorable economic conditions;
•negatively impact global demand for our products, which could result in a reduction of sales, operating profit and cash flows;
•decrease the value of our investments in equity and debt securities, including our company-owned life insurance and pension plan assets, which could result in higher pension cost and statutorily mandated funding requirements; and
•impair the financial viability of our insurers.
Furthermore, inflation has and may continue to increase our operational costs, including labor costs and feed ingredient costs, and continued increases in interest rates in response to concerns about inflation may have the effect of further increasing economic uncertainty and heightening these risks. As a result, instability and weakness of the U.S. and global economies, and the negative effects on consumers’ spending, may materially negatively affect our business and results of operations. A prolonged period of reduced consumer spending could have an adverse effect on our business and our results of operations.
35
If tax laws change or we experience adverse outcomes resulting from examination of our tax returns or disagreements with taxing authorities, it could adversely affect our business, financial condition and results of operations.
We are subject to federal, state, and local tax laws and regulations in the U.S. The application and interpretation of these laws in different jurisdictions affect our operations in complex ways and are subject to change, and some changes may be retroactively applied. Our future effective tax rates and the value of our deferred tax assets and liabilities could be adversely affected by changes in tax laws. Furthermore, the European carve-out may result in incremental tax liability to us. The U.S. and U.S. states and localities are also actively considering changes to existing tax laws that, if enacted, could increase our tax obligations or require us to change the manner in which we operate our business.
In addition, we are subject to the examination of our income and other tax returns by the Internal Revenue Service and other tax authorities. We regularly assess the likelihood of adverse outcomes resulting from such examinations to determine the adequacy of our provision for income taxes. Although we believe we have made appropriate provisions for taxes in the jurisdictions in which we operate, changes in the tax laws, or challenges from tax authorities under existing tax laws could adversely affect our business, financial condition and results of operations.
We face risks associated with the long-term trend toward increased activism against companies in the food products industry.
The treatment of animals and related standards of care in the food products industry have been subject to increasing focus by animal rights groups. We and many of our customers face pressure from animal rights groups to operate our respective businesses in a manner that treats animals in conformity with certain standards developed or approved by these groups. Some of our customers also require us to comply with specified animal rights standards and audits of our facilities. Animal rights groups have also engaged in legislative efforts to ban any form of gestation crates in various states. Conforming to requirements imposed on our business by animal rights groups has caused us and may in the future cause us to incur increased costs.
Animal rights groups have in the past:
•used pressure tactics in an effort to generate adverse publicity regarding our company;
•trespassed on and otherwise damaged our properties; and
•sought to disrupt our business operations or those of our suppliers and customers through protests.
These groups have, and may continue to, coordinate their actions with other groups, threaten strikes or boycotts or enlist the support of well-known persons or organizations in order to increase the pressure on us to achieve their stated aims. Future activist actions could include one or more of the following:
•property damage;
•disruptions to our business operations;
•contamination of our hogs and food supply;
•outbreak of disease;
•cyberattacks;
•legal challenges or lawsuits;
•negative publicity about our business or the food products industry in general;
•reduction in demand for our products; and
•other adverse effects on our ability to develop our properties and expand our operations.
36
These actions could have a material adverse effect on our reputation and, in turn, our business, results of operations, financial condition and prospects. We may need to incur significant costs associated with responding to these or other initiatives, and there is no guarantee that our responses will produce favorable outcomes.
Risks Relating to Government Regulations
We are subject to extensive governmental regulations, which require significant compliance expenditures.
We are subject to extensive federal, state and local regulations. Our food processing facilities and products are subject to frequent inspection by the USDA, the FDA and various state and local health and agricultural agencies. Applicable statutes and regulations governing food products include rules for labeling the content of specific types of foods, the nutritional value of that food and its serving size, as well as rules that protect against contamination of products by food-borne pathogens. Many jurisdictions also require that food producers adhere to good production practices (the definition of which may vary by jurisdiction) with respect to production processes. Recently, the food safety practices and procedures in the meat processing industry have been subject to more intense scrutiny and oversight by the USDA and state authorities and future outbreaks of diseases among cattle, poultry or pigs could lead to further governmental regulation. In addition, our production facilities and distribution centers are subject to various federal, state and local laws and regulations relating to workplace safety and workplace health. Our exported products are often inspected by foreign food safety authorities, and any violation discovered during these inspections may result in a partial or total return of a shipment, partial or total destruction of the shipment and costs due to delays in product deliveries to our customers.
Our Bioscience operations are also subject to regulations from various government authorities, including the FDA, USDA and EPA. Compliance with these and other agency requirements, which are subject to change, affect our operations and may impact our results at one or more of our facilities. Additionally, the loss of or failure to obtain necessary permits or registrations, or failure to comply with these regulations, at any of our facilities could result in (1) the suspension or restriction of our heparin operations, (2) administrative penalties and injunctive relief, (3) civil penalties such as fines, injunctions and product recalls and/or (4) negative publicity.
We seek to comply with applicable regulations through using internationally recognized management systems to manage our regulatory and compliance programs, employing data analytics to monitor food safety indicators and taking corrective action if necessary, and working with the USDA and the FDA on projects aimed at improving food safety and increasing consumer protection. Failure by us, our contract farms or our co-manufacturers to comply with applicable laws and regulations or maintain permits, licenses or registrations relating to our or our co-manufacturers’ operations could subject us to civil remedies or penalties, including fines, injunctions, recalls or seizures, warning letters, restrictions on the marketing or manufacturing of products, or refusals to permit the import or export of products, as well as potential criminal sanctions, which could result in increased operating costs resulting in a material effect on our operating results and business.
In addition, developments or changes in the regulatory environment may have a material impact on our business. For example, President Biden issued an executive order in July 2021 that, among other things, directed federal agencies to enforce antitrust laws more vigorously than past administrations, which may, among other things, make acquisition transactions more challenging. As a subsidiary of a public company based outside of the U.S., we may also face heightened scrutiny in respect of potential acquisition transactions. See the section titled “Item 1. Business—Quality Assurance and Food Safety—Regulation” for further information on the regulations to which we are subject.
Governmental authorities may take further action restricting our ability to produce and/or sell livestock or adopt new regulations impacting our production or processing operations, which could adversely affect our business.
A number of states have adopted legislation that prohibits or restricts the ability of meat packers, or in some cases corporations generally, from owning livestock or engaging in farming. In addition, the U.S. Congress has in the past considered federal legislation that would ban meat packers from owning livestock. We cannot assure you that such or similar legislation affecting our operations will not be adopted at the federal or state levels in the future. Such legislation, if adopted and applicable to our current operations and not successfully challenged or settled, could have a material adverse impact on our operations and our financial statements.
37
An increasing number of states are proposing or adopting legislation that prohibits or limits entities directly or indirectly controlled by individuals or entities based in the People’s Republic of China (“PRC”) from acquiring or owning an interest in private agricultural land within the boundaries of their state. In some cases, the adopted or proposed legislation goes beyond private agricultural land to include any land, meaning land on which we currently maintain production plants or other facilities could be covered by the legislation. We cannot assure you that such or similar legislation affecting our operations will not be adopted in additional states in the future. Such legislation, if adopted and applicable to our current operations and not successfully challenged or settled, could require us to divest land that is critical to our operations and could have a material adverse impact on our operations and our financial statements.
In addition, the State of California enacted the Farm Animal Confinement Initiative (“Proposition 12”), which became enforceable on July 1, 2023. Proposition 12 prohibits the sale within the state of certain uncooked pork produced from breeding sows or their offspring unless the animals have been housed in confinement systems that meet certain minimum standards and other conditions are met. Similarly, Massachusetts Question 3 prohibits the sale of certain pork products within the State of Massachusetts, as well as the shipment of certain pork products through the state, unless the products came from animals that were also housed in confinement systems that meet certain minimum standards. Our sales into California and into or through Massachusetts accounted for approximately 6% of our consolidated sales for the year ended December 29, 2024, and approximately 17% of those sales into California and into or through Massachusetts were subject to either Proposition 12 in California or Question 3 in Massachusetts.
In fiscal year 2008, North Carolina enacted a permanent moratorium on the construction of new hog farms that use the lagoon and sprayfield system. The moratorium limits us from expanding our North Carolina hog production operations. This permanent moratorium replaced a 10-year moratorium on the construction of hog farms with more than 250 hogs or the expansion of existing large farms. This moratorium may over time lead to increased difficulties in our ability to contract with independent growers.
We are, and could become, subject to legal proceedings and regulatory investigations that may result in significant expenses, fines and reputational damage.
We are involved on an ongoing basis in litigation arising in the ordinary course of business or otherwise. For example, we have been named as one of 16 defendants in a series of purported class actions alleging antitrust violations in the pork industry. The plaintiffs in all of these cases also challenge the defendant pork producers’ use of benchmarking reports from defendant Agri Stats, Inc., alleging that the reports allowed the pork producers to share proprietary information and monitor each producer’s compliance with the supposed agreement to reduce supply. Payments in an aggregated amount of $194 million were made by us to settle all class claims against us by the direct purchasers, commercial and institutional indirect purchasers and consumer indirect purchasers. In addition to the class actions, we have been named as a defendant in similar claims and suits brought by a number of individual purchasers who opted out of their class and three states or commonwealths. We have entered into negotiations with many of these claimants and have settled certain of the pending non-class cases and related claims. Currently, 22 opt-out cases and one case by the State of New Mexico remain pending against us.
We intend to vigorously defend against these claims, but we cannot assure you that we will be successful or that additional similar claims will not arise in the future. We established a reserve for these claims, however we cannot assure you that the reserve will not have to be increased, as applicable.
Trends in litigation may include class actions involving consumers, shareholders, employees or injured persons and claims related to commercial, labor, employment, antitrust, securities or environmental matters. Moreover, the process of litigating cases, even if we are successful, may be costly, and may approximate the cost of damages sought. These actions could also expose us to adverse publicity, which might adversely affect our brands, reputation and/or customer preference for our products and distract management from other tasks. Litigation trends and expenses and the outcome of litigation cannot be predicted with certainty and adverse litigation trends, expenses and outcomes could adversely affect our business, financial condition and results of operations. See “—Risks Relating to Government Regulations—Environmental regulation and related litigation and commitments could have a material adverse effect on us” for further information regarding ligation involving environmental matters.
38
Government antitrust and foreign investment policies and regulations may limit our strategic growth opportunities, including certain acquisitions and joint ventures.
The U.S. and many non-U.S. jurisdictions have laws designed to protect national security or to restrict foreign direct investment. In the U.S., the Committee on Foreign Investment in the U.S. (“CFIUS”) has the authority to review transactions that afford foreign investors the ability to “control” a U.S. business, as well as certain non-controlling investments. If CFIUS identifies a national security risk arising from a particular transaction, it can impose mitigation measures and can also intervene to prohibit the transaction or order a divestment if the transaction has already closed. Many non-U.S. jurisdictions restrict foreign investment in assets important to national security by taking steps including, but not limited to, placing limitations, restrictions or conditions on foreign equity investment, implementing investment screening or approval mechanisms and restricting the employment of foreigners as key personnel. These U.S. and foreign laws could limit our ability to invest in certain businesses or joint ventures or impose burdensome notification requirements, operational restrictions or delays in pursuing and consummating transactions.
Certain of our acquisitions or investments may be subject to review and approval by CFIUS or any non-U.S. equivalents thereof based on our ownership structure and scope of operations. This may have outsized impacts on transaction certainty, timing, feasibility and cost, and could prevent us from maintaining or pursuing acquisition or investment opportunities that we otherwise would have maintained or pursued. CFIUS or any non-U.S. equivalents thereof may seek to impose limitations, conditions or restrictions on or prohibit one or more of our acquisitions or investments, which may adversely affect our flexibility in structuring or financing certain acquisition transactions. In addition, CFIUS is actively pursuing transactions that were not notified to it voluntarily and may ask questions regarding, or impose restrictions, conditions or limitations on, transactions post-closing. Although CFIUS reviews (and in some cases mitigates) foreign investment originating from various countries, it has placed significant focus on reviews involving investors either directly or indirectly controlled by individuals or entities based in the PRC. As a result, acquisitions or investments undertaken by us could be subject to heightened CFIUS scrutiny compared to acquisitions or investments made by other foreign investors. These risks have increased and may continue to increase due to geopolitical, policy or regulatory developments, particularly with regard to U.S.-PRC relations. On February 21, 2025, President Trump issued a National Security Memorandum on America First Investment Policy directing CFIUS to impose greater scrutiny on acquisitions or investments by PRC-affiliated persons, including a call to “restrict PRC-affiliated persons from investing in U.S. technology, critical infrastructure, healthcare, agriculture, energy, raw materials or other strategic sectors.”
In addition, the U.S. Department of Justice Antitrust Division and the Federal Trade Commission, the two agencies responsible for enforcing federal antitrust and competition laws, issued new Merger Guidelines in December 2023, designed to invigorate enforcement of the antitrust and competition laws. These initiatives are expected to increase scrutiny of mergers and acquisitions subject to premerger review and those already consummated. As a result, the review process from U.S. antitrust agencies and other non-U.S. antitrust authorities for mergers and acquisitions undertaken by us is expected to become more challenging, more time consuming and more expensive. We may even be required to undergo investigations concerning previously closed transactions. If certain proposed acquisitions are delayed or rejected by antitrust enforcers, or if previously closed transactions are investigated, it could have an adverse impact on our business, as well as limit our opportunities for future strategic growth through acquisitions. In addition, competition rules from other U.S. federal agencies, including the USDA, as well as state competition laws could create additional hurdles.
Furthermore, complying with these laws imposes potentially significant costs and complex additional burdens, and any failure by us to comply with them could expose us to significant penalties, sanctions, loss of future investment opportunities, additional regulatory scrutiny and reputational harm.
Environmental regulation and related litigation and commitments could have a material adverse effect on us.
Our past and present business operations and properties are subject to extensive and increasingly stringent federal, state, local and foreign laws and regulations pertaining to protection of the environment, including:
•the treatment of hazardous materials and the discharge of such materials into the environment;
39
•the handling and disposition of manure and liquid and solid wastes; and
•air emissions.
We have incurred and expect to continue to incur significant costs complying with environmental laws and regulations. Failure to comply with, and liabilities under, these laws and regulations in the future may result in significant additional consequences to us, including administrative, civil and criminal penalties, cleanup and other environmental damages, negative publicity and increased compliance costs. Some requirements applicable to us, including the Clean Water Act and the Clean Air Act, may also be enforced by citizen groups or other third parties. Natural disasters, such as flooding and hurricanes, can cause the discharge of effluents or other waste into the environment, which have in the past and may in the future result in litigation and governmental enforcement actions against us or new or additional governmental regulations applicable to our operations. See “Item 1. Business—Quality Assurance and Food Safety—Regulation” for further discussion of regulatory compliance as it relates to environmental risk. We have incurred, and will continue to incur, significant capital and operating expenditures to comply with these laws and regulations.
We also face the risk of lawsuits even if we are operating in compliance with applicable regulations. For example, in recent years various nuisance suits were filed against us and our subsidiary Murphy-Brown LLC in North Carolina. Several of these lawsuits resulted in unfavorable outcomes to us. We resolved all then-existing filed cases in July 2019 pursuant to a settlement agreement, however we have since been involved in other pending and threatened nuisance suits and claims related to both farms and other facilities. We cannot assure you that additional or similar claims relating to our farming operations (whether sounding in nuisance or other torts or causes of action) will not arise in the future.
In addition, new environmental issues could arise that would cause currently unanticipated investigations, assessments or expenditures. U.S. federal, international, state and local authorities may, from time to time, adopt revisions to environmental rules and regulations with which we must comply. New or more stringent laws or regulations that impose additional requirements on our operations or on us could increase the cost of doing business for us. For example, in January 2024, the EPA published draft revised Effluent Limitations Guidelines (“ELGs”) for wastewater discharges of meat and poultry facilities. The draft proposal includes a number of options for revised ELGs that the EPA is evaluating. For existing direct dischargers of wastewater, including meat processors such as us, the EPA’s preferred option is the imposition of more stringent effluent limitations for nitrogen and ammonia and, for the first time, limitations for phosphorus. This option would also establish, for the first time, pretreatment standards for oil and grease, total suspended solids and biochemical oxygen demand for these dischargers. In addition, the EPA is proposing an amendment to add E. coli bacteria limitations for direct dischargers. Another option the EPA is considering would extend the nitrogen and phosphorus limitations to indirect dischargers, which would also cover many of our facilities.
The EPA conducted a number of public hearings on the proposed ELGs in January and March 2024. It is unclear when the EPA will issue final ELGs or to what extent they will differ from what the EPA has proposed. In addition, the new U.S. administration may elect to change, or abandon, the ELGs. Significant upgrades related to our direct and indirect wastewater discharge streams, including to treatment systems at our Sioux City and Denison, Iowa, Sioux Falls, South Dakota and Tar Heel, North Carolina centers, would be required to meet the standards as proposed, which we estimate would require material capital expenditures in the aggregate.
Additionally, increased public interest in farm animal welfare could result in additional government regulation and additional or unplanned capital expenditures. Further, the regulation or taxation of carbon or other greenhouse gas (“GHG”) emissions to address climate change concerns could result in increased compliance costs and capital expenditures and may also affect the prices of commodities, energy and other inputs to our business. It is not possible at this time to predict the complete structure or outcome of any future legislative or regulatory efforts to address GHG emissions and climate change or whether costs of compliance with such efforts will have a material adverse effect on our financial position or results of operations.
40
Climate change, or legal, regulatory, voluntary or market measures to address climate change, may negatively affect our business, operations or reputation.
There is growing concern that carbon dioxide and other GHGs in the atmosphere have an adverse impact on global temperatures, weather patterns, and the frequency and severity of extreme weather and natural disasters. In the event that climate change has a negative effect on agricultural productivity, we may be subject to decreased availability or less favorable pricing for certain commodities that are necessary for our products, such as grains. We may also be subject to decreased availability or less favorable pricing for water as a result of climate change, which could impact our farming, manufacturing and distribution operations. In addition, natural disasters and extreme weather conditions may disrupt the productivity of our facilities or the operation of our supply chain.
The increasing concern over climate change also has resulted and may continue to result in more state, regional, federal, and/or global legal and regulatory requirements including changes to energy policies, increased mandatory climate-related disclosure, carbon pricing regulations or carbon taxes. For example, in March 2024 the SEC published its final rules to enhance and standardize climate-related disclosures, requiring covered entities, including us, to disclose certain climate-related metrics and GHG emissions data, information about climate-related targets and goals and climate-related risks and obtain attestation requirements. The rules are currently stayed pending the resolution of litigation challenging the rules, although the new administration has stated that it will deliberate and determine appropriate next steps in light of the new administration’s position. At this time, we cannot predict the costs of implementation or any potential adverse impacts resulting from the new rules, should they become effective. However, we may incur increased costs relating to the assessment and disclosure of climate-related risks and targets. We may also be subject to increased litigation risks related to disclosures made pursuant to any federal or state reporting requirements or voluntary climate-related reporting, which could materially and adversely affect our future results of operations and financial condition.
Collecting, measuring and analyzing information relating to our GHG emissions or impacts of climate change on our business is costly, time-consuming, and dependent on third-party cooperation and such information may ultimately be unreliable. Furthermore, methodologies for measuring, tracking and reporting on such matters are evolving, and may be ambiguous and subject to rapid change, which may require our processes, benchmarks, baselines and controls for such data to evolve as well. Organizational changes may result in data recalculations. Quantifying GHG emissions within the boundaries of a business is a relatively nascent exercise, and we, like other companies in our industry, have refined and updated our methodologies following prior publication of data. For example, there have been inconsistent practices across many U.S. pork/poultry and dairy producers in quantifying our GHG emissions where biogas eligible for carbon reduction credits is also produced on farms. We have revised baselines and previously reported GHG emissions for our U.S. operations, as well as our carbon reduction goals, as a result of guidance clarifying the accounting for biogas credits in this context. Our GHG footprint has also changed as a result of closure or sale of plants, acquisition of new plants and reduction of farm operations. Furthermore, like many peer companies, our data collection, analysis and reporting capabilities have developed from a starting point with very limited established guidance or methodology. See “Item 1. Business—Sustainability.” We have engaged a third-party consultant to conduct a review of the GHG emissions attributable to our worldwide businesses, our energy use and our value chain, and that analysis is ongoing. We expect additional changes to the methodologies to quantify our GHG emissions and possibly our climate-related goals as a result of this work.
Like many companies, our quantification of GHG emissions attributable to our business and our carbon reduction goals have been voluntary to date. The process of quantifying our GHG emissions and setting carbon reduction goals, as well as a perceived or actual lack of progress in these endeavors, can subject companies such as ours to criticism, investigations, regulatory enforcement, litigation and other risks. In addition, failure to achieve our GHG emissions reduction goals could harm our reputation, which could have a material adverse effect on our results of operations, financial condition and liquidity. We may also face increased pressure from customers, consumers, investors, activists and other stakeholders to modify our products or operations to exclude ingredients or activities that are considered to have a greater impact on climate change.
Our ability to achieve any of our climate-related strategies, expectations, goals and targets is also subject to factors and conditions that are outside of our control. Examples of such factors include, but are not limited to, evolving regulatory and other standards, processes and assumptions, the pace of scientific and technological developments,
41
increased costs and the availability of requisite financing, market trends that may alter business opportunities, the conduct of third-party manufacturers and suppliers, constraints or disruptions to our supply chain and changes in carbon markets or carbon taxes. We may be required to expend significant resources in the near or long-term future to achieve these strategies and expectations, which could significantly increase our operational costs and, despite such efforts, may be unable to achieve such strategies or meet customer or investor expectations.
Risks Relating to Our Capital Structure
We may require additional financing to achieve our goals, and the failure to obtain this necessary capital when needed on acceptable terms, or at all, may force us to delay, limit, reduce or terminate our product manufacturing and development, and other operations.
We have funded our operations primarily through equity financing, long-term senior unsecured notes, committed revolving credit facilities, commercial paper and sales of our products. We have incurred and expect to continue to incur significant capital expenditures related to the expansion and automation of our processing capacity and maintenance of our facilities. We believe that we will continue to expend substantial resources for the foreseeable future as we consider additional markets to pursue and other growth opportunities. In addition, our operating performance and cash flow may not be sufficient to meet all our debt service requirements, return value to shareholders such as through payment of dividends or repurchase of shares of our common stock, and achieve our target Ratio of Net Debt to Adjusted EBITDA or our target minimum liquidity.
Our operating plan may change because of factors currently unknown to us, and we may need to seek additional funds sooner than planned, through public or private equity or debt financing or other sources. We may also seek financing in connection with potential new product introductions or acquisitions or investments in businesses or technologies that we believe could offer growth opportunities. Such financing may result in dilution to shareholders, imposition of affirmative and negative covenants and debt repayment obligations, or other restrictions, any of which may adversely affect our business. In addition, we may seek additional capital due to favorable market conditions or strategic considerations even if we believe we have sufficient funds for our current or future operating plans.
Our affiliation with WH Group has historically provided us with higher credit ratings. The terms of additional financing we incur in the future may not be as favorable as those previously obtained. Our ability to access additional capital may further be affected by adverse or uncertain economic conditions. Weakness and volatility in the capital markets and the economy in general could make it more difficult to access the capital markets and could increase our cost of borrowing.
Our level of indebtedness and the terms of our indebtedness could adversely affect our business and liquidity position.
As of December 29, 2024, we had, on a consolidated basis, $2,002 million of outstanding total debt and finance lease obligations and $2,303 million of undrawn capacity including $2,100 million under the Senior Revolving Credit Facility (as defined in “Item 7. Management’s Discussion and Analysis of Financial Condition and Results of Operations—Liquidity and Capital Resources—Credit Facilities—Senior Unsecured Revolving Credit Facility”) and $203 million million under the Securitization Facility (as defined in “Item 7. Management’s Discussion and Analysis of Financial Condition and Results of Operations—Liquidity and Capital Resources—Credit Facilities—Accounts Receivable Securitization Facility”) (after giving effect to $22 million of issued but undrawn letters of credit).
Because the borrowing capacity under the Securitization Facility depends, in part, on accounts receivable levels, which fluctuate from time to time, such amounts may not reflect actual borrowing capacity. The Senior Revolving Credit Facility is a fixed commitment facility and is not dependent on a borrowing base. In addition, on or before the maturity date of the Senior Revolving Credit Facility, we have the right, but not the obligation, to request an increase in the amount of commitments under the Senior Revolving Credit Facility in an aggregate amount not to exceed $500 million under customary terms and conditions.
Our indebtedness may increase from time to time for various reasons, including fluctuations in operating results, working capital needs, capital expenditures and potential acquisitions or joint ventures. In addition, due to the
42
volatile nature of the commodities markets, we may need to borrow significant amounts to cover any margin calls under our risk management and hedging programs. During fiscal year 2024, margin deposits posted by us ranged from $(11) million to $97 million (negative amounts representing margin deposits we have received from our brokers). The average daily amount on deposit with our brokers during fiscal year 2024 was $27 million. As of December 29, 2024, our net amount of margin held on deposit was $60 million.
Our consolidated indebtedness level could significantly affect our business and the value of our common stock because:
•it may, together with the financial and other affirmative and negative covenants in the agreements governing our indebtedness, limit or impair our ability in the future to obtain financing, refinance any of our indebtedness, sell assets or raise equity or debt on commercially reasonable terms or at all, which could cause us to default on our obligations, materially impair our liquidity or otherwise adversely affect our business and the value of our common stock;
•a downgrade in our credit rating (including the loss of our investment grade credit ratings) could restrict or impede our ability to access capital markets at attractive rates and increase the cost of future borrowings;
•it may, through event of default provisions, limit our ability to enter into change of control transactions, which may impede our ability to enter into certain transactions;
•it may reduce our flexibility to respond to changing business and economic conditions or to take advantage of business opportunities that may arise;
•it may place us at a competitive disadvantage relative to some of our competitors that have less indebtedness than we do;
•a portion of our cash flow from operations must be dedicated to interest payments on our indebtedness and is not available for other purposes, which amount could increase if prevailing interest rates rise or if we incur additional indebtedness;
•substantially all of our accounts receivable in the U.S. secure the Securitization Facility, all of which could limit our ability to dispose of such assets or utilize the proceeds of such dispositions and, upon an event of default under any such secured indebtedness, the lender thereunder could foreclose upon our pledged assets; and
•it could make us more vulnerable to downturns in general economic or industry conditions or in our business.
Further, our debt agreements, under certain circumstances, either currently or in the future, may require us to maintain investment grade credit ratings and certain financial ratio covenants, and may limit additional borrowings, investments, the payment of dividends and other restricted payments, the acquisition or disposition of assets, mergers and consolidations, transactions with affiliates, the creation of liens, entrance into swap agreements, sale/leaseback transactions and the repayment of certain debt. We cannot assure you that any of these limitations will not hinder our ability to finance operations and capital needs and our ability to pursue business opportunities and activities that may be in our interest.
In addition, should market conditions deteriorate, or should our operating results otherwise be depressed in the future, we may have to request amendments or waivers to our covenants and restrictions under our debt agreements. There can be no assurance that we will be able to obtain such relief should it be needed in the future. A breach of any of these covenants or restrictions could result in a default that would permit our senior lenders, including lenders under the Senior Revolving Credit Facility and the Securitization Facility and the holders of our other debt financing facilities, as the case may be, to declare all amounts outstanding under the Senior Revolving Credit Facility, the Securitization Facility and our other debt financing facilities, as applicable, to be due and payable, together with accrued and unpaid interest, and the commitments of the relevant lenders to make further extensions of credit under the Senior Revolving Credit Facility and the Securitization Facility could be terminated. If we were unable to repay
43
our secured indebtedness to our lenders, these lenders could proceed against the collateral securing that indebtedness, which could include substantially all of our accounts receivable assets in the U.S.
Our future ability to comply with financial covenants and other conditions, make scheduled payments of principal and interest, or refinance existing borrowings depends on our future business performance which is subject to economic, financial, competitive and other factors, including the other risks set forth in this section, and may be affected by events beyond our control. Any failure to comply with the covenants of our debt agreements could have a material adverse effect on our business, financial condition, results of operations and prospects.
Additionally, the repayment obligations under our outstanding debt may have the effect of discouraging, delaying or preventing a takeover of our company.
We may not be able to generate sufficient cash to service all of our indebtedness.
Our ability to make payments on and to refinance our indebtedness and to fund planned capital expenditures and other strategic investments will depend on our ability to generate cash in the future. This, to a certain extent, is subject to general economic, financial, competitive, legislative, regulatory and other factors that are beyond our control. We may not generate sufficient cash flow from operations, and we cannot assure you that future borrowings will be available to us in an amount sufficient to enable us to pay our indebtedness or to fund our other liquidity needs.
If we do not generate cash flow from operations sufficient to pay our debt service obligations, we may have to undertake alternative financing plans, such as refinancing or restructuring our debt, selling assets, reducing or delaying capital investments or seeking to raise additional capital. Our ability to refinance our debt will depend on the condition of the capital markets and our financial condition at that time. Any refinancing of our debt could be at higher interest rates and may require us to comply with more onerous covenants, which could further restrict our business operations.
In addition, we conduct our operations through our subsidiaries, certain of which are not, and in the future may not be, guarantors of our indebtedness. Accordingly, repayment of our indebtedness is dependent on the generation of cash flow by our subsidiaries and their ability to make such cash available to us, by dividend, intercompany transfer, debt repayment or otherwise. Due to the restrictive covenants under certain debt agreements, our subsidiaries may be restricted from distributing dividends to enable us to make payments in respect of our indebtedness. In addition, unless they are guarantors of our indebtedness, our subsidiaries do not have any obligation to pay amounts due on our indebtedness or to make funds available for that purpose.
If drawn upon, our current variable rate indebtedness would subject us to interest rate risk, which could cause our debt service obligations to increase.
Our Senior Revolving Credit Facility and Securitization Facility have variable interest rates. Market interest rates have increased over the past several years and may increase in the future as a result of action by the U.S. Federal Reserve and other factors, and as a result, variable-rate debt may create higher debt service requirements, which would adversely affect our cash flow. If we draw upon our variable rate indebtedness and interest rates increase, our debt service obligations on our variable rate indebtedness would increase even though the amount borrowed would remain the same.
In particular, our borrowings under the Senior Revolving Credit Facility bear interest at the Secured Overnight Financing Rate (“SOFR”) or the Eurocurrency Rate (as defined in the Senior Revolving Credit Facility), plus a margin ranging from 0.875% to 1.50% per annum, or, at our election, at a base rate plus a margin ranging from 0.00% to 0.50% per annum, in each case depending on our senior unsecured debt rating. To the extent we draw from our Senior Revolving Credit Facility, we may subject to interest rate risk which could cause our debt service obligations to increase. We may also enter into additional variable rate indebtedness in the future.
There can also be no assurance that SOFR or the Eurocurrency Rate will perform in the same way as the Senior Revolving Credit Facility’s original benchmark London interbank Offered Rates (“LIBOR”) would have at any
44
time, including as a result of changes in interest and yield rates in the market, market volatility or global or regional economic, financial, political, regulatory, judicial or other events.
Despite current indebtedness levels and restrictive covenants, we may incur additional indebtedness. This could further exacerbate the risks associated with our financial leverage.
Despite current indebtedness levels and restrictive covenants, we expect to incur additional indebtedness and may incur other indebtedness to finance our operations and other capital needs. Although the agreements governing our indebtedness contain restrictions on the incurrence of additional indebtedness, these restrictions are subject to a number of thresholds, qualifications and exceptions, and the additional indebtedness incurred in compliance with these restrictions could be substantial. If additional debt is incurred, the related risks that we now face as a result of our leverage would intensify.
Risks Relating to Our Relationship with WH Group
We are a “controlled company” within the meaning of the rules of Nasdaq and, as a result, qualify for, and rely on, exemptions from certain corporate governance requirements. You will not have the same protections afforded to shareholders of other companies that are subject to such requirements.
As of March 24, 2025, WH Group beneficially owned approximately 92.7% of our outstanding shares of common stock. As a result, we are a “controlled company” within the meaning of the corporate governance standards of Nasdaq. Under these rules, a company of which more than 50% of the voting power is held by an individual, group or another company is a “controlled company” and may elect not to comply with certain corporate governance requirements, including requirements that:
•a majority of our board consist of “independent directors” as defined under the rules of Nasdaq;
•our director nominees be selected, or recommended for our board’s selection, by a nominating and governance committee comprised solely of independent directors;
•the compensation of our executive officers be determined, or recommended to our board for determination, by a compensation committee comprised solely of independent directors; and
•an annual performance evaluation of the nominating and governance and compensation committees be performed.
We currently utilize these exemptions. Accordingly, you will not have the same protections afforded to shareholders of companies that are subject to all of the corporate governance requirements of Nasdaq. These exemptions do not modify the independence requirements for our audit committee. There is no single shareholder or group of shareholders which owns 50% or more of the voting power of WH Group as of March 24, 2025. As a result, WH Group is not considered a controlled company within the meaning of the corporate governance standards of Nasdaq.
WH Group controls us, and their interests may conflict with ours or yours in the future.
For so long as WH Group owns, in the aggregate, a majority of our then outstanding shares of our common stock, WH Group shall have the right to designate, for inclusion in the slate of directors nominated by our board for election to our board, a majority of the directors on our board and control the composition of our board and the approval of actions requiring shareholder approval through its voting power. Even when WH Group ceases to own a majority of our then outstanding shares of common stock, for so long as WH Group continues to own, in the aggregate, at least 10% of our then outstanding shares of common stock, WH Group shall be entitled to designate, for inclusion in the slate of directors nominated by the board for election to our board, a number of the total number of directors entitled to serve on the board proportionate to the percentage of our outstanding common stock owned by WH Group, rounded up to the nearest whole number. In addition, our amended and restated articles of incorporation provides that at any time that WH Group owns at least a majority of our then outstanding shares of common stock, shareholders are permitted to take action by written consent. For the purpose of determining ownership of our common stock for these purposes, references to WH Group include WH Group, its successors by way of merger or transfer of all or substantially all of its assets, any entity that is 50% beneficially owned by WH
45
Group, and any entity that acquires a majority of our then outstanding shares of common stock directly from any of the foregoing that is a shareholder of our company.
As a result, WH Group is generally able to control, whether directly or indirectly through its ability to remove and elect directors, and subject to applicable law, substantially all matters affecting us, including:
•any determination with respect to our business direction and policies, including the election and removal or directors and the appointment and removal of officers;
•any determinations with respect to mergers, amalgamations, business combinations or disposition of assets;
•our financing and dividend policy, and the payment of dividends on our common stock, if any;
•compensation and benefit programs and other human resources policy decisions;
•changes to any other agreements that may adversely affect us; and
•determinations with respect to our tax returns and other tax matters.
In particular, for so long as WH Group continues to own a significant percentage of our common stock, WH Group will be able to cause or prevent a change of control of our company or a change in the composition of our board, and could preclude any unsolicited acquisition of our company. The concentration of ownership could deprive you of an opportunity to receive a premium for your common stock as part of a sale of our company and ultimately might affect the market price of our common stock.
If WH Group sells a controlling interest in our company to a third party in a private transaction, you may not realize any change of control premium on shares of our common stock and we may become subject to the control of a presently unknown third party.
WH Group owns a controlling equity interest in our company and therefore has the ability, should it choose to do so, to sell some or all of its shares of our common stock in a privately negotiated transaction, which, if sufficient in size, could result in a change of control of our company.
The ability of WH Group to privately sell its shares of our common stock, with no requirement for a concurrent offer to be made to acquire all of the shares of our common stock that will be publicly traded hereafter, could prevent you from realizing any change of control premium on your shares of our common stock that may otherwise accrue to WH Group on its private sale of our common stock. Additionally, if WH Group privately sells its controlling interest in our company, we may become subject to the control of a presently unknown third party. Such third party may have interests that conflict with those of other shareholders.
Certain of our directors may have actual or potential conflicts of interest because of their equity interest in WH Group. Also, certain of WH Group’s current executive officers also serve as directors of our company, which may create conflicts of interest, or the appearance of conflicts of interest.
Because of their positions with WH Group, certain of our directors own equity interests in WH Group. Continuing ownership of shares of WH Group’s common stock and equity awards could create, or appear to create, potential conflicts of interest if we and WH Group face decisions that could have implications for both WH Group and us. In addition, certain of WH Group’s current executive officers also serve as directors of our company, and this could create, or appear to create, potential conflicts of interest when we and WH Group encounter opportunities or face decisions that could have implications for both companies or in connection with the allocation of such directors’ time between WH Group and us. These potential conflicts could arise, for example, over matters such as the desirability of changes in our business and operations, funding and capital matters, regulatory matters and other agreements with WH Group relating to the commercial arrangements in the future, employee retention or recruiting or our dividend policy.
While our board believes that, given its size and structure, such actual or potential conflicts of interest can be managed adequately, including that the independent members of our board may meet in the absence of senior
46
executive officers or non-independent directors in respect of the relevant matter, the actual or perceived conflicts of interest that may arise could cause reputational or other harm.
In addition, we have, and expect to continue to be, engaged in related party transactions with WH Group and its affiliates. In all related party transactions, there is a risk that a related party’s influence may be such that the transaction terms could be viewed as favorable to that related party, even if we strive to reach arms-length transaction terms. The appearance of conflicts of interest created by related party transactions could impair the confidence of our investors. Furthermore, WH Group has certain non-compete arrangements with Henan Shuanghui Investment & Development Co., Ltd. (“Shuanghui Development”), which provide that there will be no competition between Shuanghui Development on the one hand, and WH Group and entities controlled by WH Group, on the other hand, regarding the operation of meat business in the PRC. Such undertaking by WH Group may restrict us from engaging in certain activities that would compete with Shuanghui Development and may limit our ability to pursue business opportunities in the manner that we desire, which could adversely affect our business, financial condition and results of operations.
WH Group indemnifies us for certain liabilities. However, there can be no assurance that the indemnity will be sufficient to insure us against the full amount of such liabilities, or that WH Group’s ability to satisfy its indemnification obligation will not be impaired in the future.
Pursuant to the shareholders agreement and certain other agreements with WH Group, WH Group has agreed to indemnify us, our affiliates and subsidiaries and each of our officers, directors, employees and agents for any losses arising out of or due to liabilities or alleged liabilities for the operation of WH Group’s business or any untrue statement or alleged untrue statement of a material fact contained in any document filed with the SEC, or any omission or alleged omission to state a material fact required to be stated in any document filed with the SEC and to the extent such statement or omission was made based on information provided by WH Group. However, third parties could also seek to hold us responsible for any of the liabilities that WH Group has agreed to retain, and there can be no assurance that the indemnity from WH Group will be sufficient to protect us against the full amount of such liabilities, or that WH Group will be able to fully satisfy its indemnification obligations. In addition, WH Group’s insurance will not necessarily be available to us for liabilities associated with occurrences of indemnified liabilities prior to the closing of our IPO, and in any event WH Group’s insurers may deny coverage to us for liabilities associated with certain occurrences of indemnified liabilities prior to the closing of our IPO. Moreover, even if we ultimately succeed in recovering from WH Group or such insurance providers any amounts for which we are held liable, we may be temporarily required to bear these losses. Each of these risks could negatively affect our business, financial condition or results of operations.
Changes in relations between the U.S. and the PRC, or in U.S. regulations concerning the PRC, may adversely impact our business, financial condition, results of operations, our ability to raise capital or the market price of our common stock.
The U.S. government, including its agencies such as the SEC, has made statements and taken certain actions that have led to, and may in the future make statements or take actions that would lead to, changes in relations between the U.S. and the PRC, which statements and actions could impact companies, including us, with connections to the PRC. In particular, the U.S. may in the future impose policies on or increase scrutiny of companies having operations in the PRC, such as WH Group, or companies in the U.S. with significant PRC ownership. These could restrict or negatively impact our business or our ability to access the U.S. capital markets. More broadly, changes in political conditions in the PRC and changes in the state of U.S.-PRC relations, including any tensions relating to potential military conflict between the PRC and Taiwan, are difficult to predict and could lead to policies or regulations that adversely affect our business, financial condition or results of operations on account of our controlling shareholder’s ties to the PRC. Furthermore, continued or increased tension in U.S.-PRC relations or any deterioration in political or trade relations between the U.S. and the PRC may lead to negative investor sentiment towards companies controlled by shareholders with significant ties to the PRC, which could make our common stock less attractive to U.S. investors and affect the market price of our common stock.
47
Our controlling shareholder is required by the stock exchange on which its shares are listed to disclose and obtain approval from its board of directors or shareholders for certain corporate actions that we undertake.
WH Group is listed on The Stock Exchange of Hong Kong Limited and is therefore subject to the applicable Hong Kong laws and regulations, including but not limited to the Rules Governing the Listing of Securities on The Stock Exchange of Hong Kong Limited (the “HKEx Listing Rules.”). Under the HKEx Listing Rules, WH Group is obligated to obtain approval from its board of directors and/or shareholders for certain transactions in which we, as a subsidiary of WH Group, engage, such as the purchase or sale of assets, mergers and acquisitions, lending, leasing of assets, donation or acceptance of assets, debt restructuring, license agreements, research and development joint ventures, and transactions with connected persons (as defined under the HKEx Listing Rules) of WH Group, the value of which exceeds certain financial thresholds established by the applicable listing rules and/or otherwise not exempted under the applicable listing rules. In addition, the HKEx Listing Rules require our controlling shareholder to obtain shareholders’ approval for certain corporate actions that we undertake, including but not limited to (1) any issuance of shares by us that results in a reduction of WH Group’s equity interest in us in excess of certain dilution thresholds and (2) the implementation of a share option and/or award scheme involving the issuance of new shares by us.
There can be no assurance that WH Group will obtain the requisite approvals if we desire to enter into any of the transactions as required under the applicable listing rules, and a failure to do so would restrict our ability to engage in such transactions. Furthermore, regulators including The Stock Exchange of Hong Kong Limited and/or the Securities and Futures Commission of Hong Kong could impose additional restrictions or approval requirements that could impact our ability to undertake certain corporate actions. We cannot guarantee that our controlling shareholder will be able to successfully or timely obtain any of the approvals needed to permit us to undertake any of the corporate actions as required under the applicable listing rules, and the failure to do so may have a material adverse effect on our business, financial condition or results of operations.
Risks Relating to the Ownership of Our Common Stock
The obligations associated with being an independent, publicly traded company require significant resources and management attention.
As a public company, we incur significant legal, regulatory, finance, accounting, investor relations, insurance and other expenses that we did not incur as a private company, including costs associated with public company reporting requirements and costs of recruiting and retaining non-executive directors. We also have incurred and will incur costs associated with the Sarbanes-Oxley Act, the Dodd-Frank Wall Street Reform and Consumer Protection Act and related rules implemented by the SEC and Nasdaq. The expenses incurred by public companies generally for reporting and corporate governance purposes have been increasing. These rules and regulations have increased our compliance costs and made some activities more time-consuming and costly. Our management must devote a substantial amount of time to related compliance requirements, diverting the attention of management away from revenue-producing activities. These laws and regulations also could make it more difficult or costly for us to obtain certain types of insurance, including director and officer liability insurance, and we may be forced to accept reduced policy limits and coverage or incur substantially higher costs to obtain the same or similar coverage. These laws and regulations could also make it more difficult for us to attract and retain qualified persons to serve on our board, our board committees or as our executive officers. Furthermore, if we are unable to satisfy our obligations as a public company, we could be subject to delisting of our common stock, fines, sanctions and other regulatory action, and civil litigation.
Failure to comply with requirements to design, implement, and maintain effective internal controls could have a material adverse effect on our business and stock price.
As a public company, we have significant requirements for enhanced financial reporting and internal controls. The process of designing and implementing effective internal controls is a continuous effort that requires us to anticipate and react to changes in our business and the economic and regulatory environment, and to expend significant resources to maintain a system of internal controls that is adequate to satisfy our reporting obligations as a public company. If we are unable to establish or maintain appropriate internal financial reporting controls and procedures,
48
it could cause us to fail to meet our reporting obligations on a timely basis, result in material misstatements in our consolidated financial statements, and harm our results of operations. In addition, we will be required, pursuant to Section 404 of the Sarbanes-Oxley Act, to furnish a report by management on, among other things, the effectiveness of our internal control over financial reporting beginning with our second annual report. This assessment will need to include disclosure of any material weaknesses identified by our management in our internal control over financial reporting. The rules governing the standards that must be met for our management to assess our internal control over financial reporting are complex and require significant documentation, testing and possible remediation. Testing and maintaining internal controls may divert our management’s attention from other matters that are important to our business.
In connection with the implementation of the necessary procedures and practices related to internal control over financial reporting, we may identify deficiencies that we may not be able to remediate in time to meet the deadline imposed by the Sarbanes-Oxley Act for compliance with the requirements of Section 404. In addition, we may encounter problems or delays in completing the remediation of any deficiencies identified by us or our independent registered public accounting firm in connection with the issuance of their attestation report.
We may not be able to conclude on an ongoing basis that we have effective internal control over financial reporting in accordance with Section 404, or our independent registered public accounting firm may not issue an unqualified opinion. If either we are unable to conclude that we have effective internal control over financial reporting or our independent registered public accounting firm is unable to provide us with an unqualified report, investors could lose confidence in our reported financial information, which could have a material adverse effect on the trading price of our common stock.
In addition, the preparation of financial statements in conformity with GAAP requires us to make estimates and assumptions that affect the amounts reported in our combined financial statements. We base our estimates on historical experience and on various other assumptions that we believe to be reasonable under the circumstances, the results of which form the basis for making judgments about the carrying values of assets, liabilities, equity, net sales and expenses that are not readily apparent from other sources. If our assumptions change or if actual circumstances differ from our assumptions, our results of operations could be adversely affected.
We cannot be certain that an active trading market for our common stock will be sustained.
We cannot assure you that an active trading market for our common stock will be sustained. If an active and liquid trading market is not sustained, you may have difficulty selling your shares of our common stock at an attractive price or at all. An inactive market may also impair our ability to raise capital by selling shares of our common stock and may impair our ability to acquire other companies by using our shares of common stock as consideration.
Our stock price may fluctuate significantly, and you could lose all or part of your investment as a result.
We cannot predict the prices at which shares of our common stock may trade. The market price of our common stock may be highly volatile and could be subject to wide fluctuations due to a number of factors such as those listed elsewhere in this section and the following:
•results of operations that vary from the expectations of securities analysts and investors;
•results of operations that vary from those of our competitors;
•changes in expectations as to our future financial performance, including financial estimates and investment recommendations by securities analysts and investors;
•changes in market valuations of, or earnings and other announcements by, companies in our industries;
•declines in the market prices of stocks generally, particularly those of companies in our industry;
•additions or departures of key management personnel;
•strategic actions by us or our competitors;
49
•announcements by us or our competitors of significant contracts, price reductions, new services, acquisitions, dispositions, joint marketing relationships, joint ventures, other strategic relationships or capital commitments;
•changes in our market share;
•an increase in our indebtedness or the interest rates applicable to our indebtedness;
•changes in general economic or market conditions or trends in our industries or the economy as a whole;
•changes in business or regulatory conditions;
•future sales of our common stock or other securities;
•actions by WH Group or other institutional shareholders;
•investor perceptions of or the investment opportunity associated with our common stock relative to other investment alternatives;
•changes in the way we are perceived in the marketplace, including due to negative publicity or campaigns on social media to boycott certain of our products, our business or our industries;
•the public’s response to press releases or other public announcements by us or third parties, including our filings with the SEC;
•changes or proposed changes in laws or regulations or differing interpretations or enforcement thereof affecting our business;
•announcements relating to litigation or governmental investigations;
•guidance, if any, that we provide to the public, any changes in this guidance or our failure to meet this guidance;
•the development and sustainability of an active trading market for our common stock;
•changes in accounting principles; and
•other events or factors, including those resulting from informational technology system failures and disruptions, epidemics, pandemics, natural disasters, war, acts of terrorism, civil unrest, or responses to these events.
Further, the global equity markets in general have recently experienced extreme price and volume fluctuations, including as a result of the COVID-19 pandemic, economic uncertainty and changes or anticipated changes in interest rates, inflation, and liquidity concerns at financial institutions that may be unrelated to our operating performance. Continued market fluctuations could result in extreme volatility in the price of our common stock, which could cause a decline in the value of our common stock. In addition, price volatility may be greater if the public float and trading volume of our common stock is low.
In the past, following periods of market volatility, shareholders have instituted securities class action litigation against various issuers. If we were to become involved in securities litigation, it could have a substantial cost and divert resources and the attention of executive management from our business regardless of the outcome of such litigation, which may adversely affect the market price of our common stock.
50
We expect to continue paying regular dividends to our shareholders, but our ability to do so is subject to the discretion of our board and may be limited by our financial condition, our credit facilities, the indentures governing the notes we previously issued and applicable law.
We have historically paid dividends to WH Group annually, along with special dividends in some years. We initially expect to pay annual dividends in an amount equal to 50% of our net income, subject to the discretion of the board. However, the payment of dividends and other distributions is at the discretion of our board and our board may, in its discretion, increase, decrease or eliminate the payment of dividends. Our ability to pay dividends on our common stock depends on many factors, including our results of operations, financial condition, level of indebtedness, capital requirements, contractual restrictions, restrictions in our debt agreements and in any preferred stock, business prospects and other factors that our board may deem relevant. In particular, our ability to pay dividends on our common stock is limited by covenants in our credit facilities and the indentures governing the notes and may be further restricted by the terms of any future debt or preferred securities. Furthermore, Virginia law prohibits us from paying dividends or other distributions if, after giving effect to the dividend or other distribution, we would not be able to pay our debts as they become due in the usual course of business or our total assets would be less than the sum of our total liabilities plus the amount that would be needed, if we were to be dissolved at the time of the dividend or other distribution, to satisfy the preferential rights of any then outstanding shares of our preferred stock. While we do not currently believe that these restrictions will impair our ability to continue to pay regular quarterly cash dividends, there can be no assurance that we will not need to reduce or eliminate the payment of dividends on our common stock in the future.
Any shareholder whose principal currency is not the U.S. dollar will be subject to exchange rate fluctuations.
Our common stock is traded in, and any cash dividends or other distributions to be declared in respect of them, if any, will be denominated in U.S. dollars. Shareholders whose principal currency is not the U.S. dollar are thus exposed to foreign currency exchange rate risk. Any depreciation of the U.S. dollar in relation to such foreign currency would reduce the value of our common stock held by such shareholders, whereas any appreciation of the U.S. dollar would increase their value in foreign currency terms. In addition, we have not offered to our shareholders, and we do not intend to offer to our shareholders, the option to elect to receive dividends, if any, in any other currency. Consequently, our shareholders may be required to arrange their own foreign currency exchange, either through a brokerage house or otherwise, which could incur additional commissions or expenses.
Future sales or issuances, or the perception of future sales or issuances, by us or our existing shareholders in the public market could cause the market price for our common stock to decline.
The sale or issuance of substantial amounts of shares of our common stock or other securities convertible or exchangeable into shares of our common stock in the public market, or the perception that such sales or issuances could occur, including sales by our existing shareholders, could harm the prevailing market price of shares of our common stock. These sales or issuances, or the possibility that these sales or issuances may occur, also might make it more difficult for us to sell equity securities in the future at a time and at a price that we deem appropriate.
As of March 24, 2025, WH Group beneficially owned approximately 92.7% of our outstanding shares of common stock. These shares are “restricted securities” as that term is defined in Rule 144 of the Securities Act (“Rule 144”) and we have granted WH Group certain registration rights with respect to its remaining shares of our common stock. WH Group is entitled to sell these shares in the public market only if the sale of such shares is registered with the SEC or if the sale of such shares qualifies for an exemption from registration under Rule 144 or any other applicable exemption under the Securities Act. We are unable to predict with certainty whether or when WH Group will sell shares of our common stock. We, our directors and our officers and WH Group have signed lock-up agreements with the underwriters of our IPO that, subject to certain customary exceptions, restrict the sale of the shares of our common stock and certain other securities held by them for 180 days following the effectiveness of our IPO. The representative of the underwriters may, in their sole discretion and at any time without notice, release all or any portion of the shares or securities subject to any such lock-up agreements.
51
Upon the expiration of the lock-up agreements described above, all of such shares will be eligible for resale in a public market pursuant to Rule 144, subject to our compliance with the public information requirement and, in the case of shares held by WH Group, subject to volume, manner of sale and other limitations under Rule 144.
In the future, we may attempt to obtain financing or to further increase our capital resources by issuing additional shares of our common stock or by offering debt or other equity securities, including senior or subordinated notes, debt securities convertible into equity or shares of preferred stock. Our decision to issue securities in any future offering will depend on market conditions and other factors beyond our control, which may have a material adverse effect on the amount, timing or nature of our future offerings. Thus, holders of our common stock bear the risk that our future offerings may reduce the market price of our common stock and dilute their stockholdings in us.
As restrictions on resale end, or if the existing shareholders exercise their registration rights, or we register additional shares of our common stock or securities convertible into or exchangeable for shares of our common stock, or if the market anticipates any of the foregoing, the market price of our shares of common stock could drop significantly. These factors could also make it more difficult for us to raise additional funds through future offerings of our shares of common stock or other securities.
Our quarterly results of operations may fluctuate significantly and could fall below the expectations of securities analysts and investors due to seasonality and other factors, some of which are beyond our control, resulting in a decline in our stock price.
Our quarterly results of operations may fluctuate due to seasonal or other factors. Accordingly, results for any one quarter are not necessarily indicative of results to be expected for any other quarter or for any year. In addition, if we increase our marketing or promotional activity in certain periods, the seasonality of our business may be amplified. Typically, our third and fourth quarters have higher revenue due to weather and holidays. Fluctuations or changes in these seasonal patterns may adversely affect our business, financial condition and results of operations. As a result, it may be difficult to accurately forecast our results of operations and, if our forecasts are not accurate, we may fail to meet the expectations of investors and securities analysts, which could cause the trading price of our common stock to fall substantially and potentially subject us to costly lawsuits, including securities class action suits.
If securities analysts do not publish research or reports about our business or if they downgrade our stock or our sector, our stock price and trading volume could decline.
The trading market for our common stock relies in part on the research and reports that industry or financial analysts publish about us or our business. We do not control these analysts. Furthermore, if one or more of the analysts who do cover us downgrade our stock or our industries, or the stock of any of our competitors, or publish inaccurate or unfavorable research about our business, or if our operating results do not meet their expectations, the price of our stock could decline. If one or more of these analysts ceases coverage of us or fails to publish reports on us regularly, we could lose visibility in the market, which in turn could cause our stock price or trading volume to decline.
Anti-takeover provisions in our organizational documents and provisions in existing and future debt agreements could delay or prevent a change of control.
Certain provisions of our amended and restated articles of incorporation and our amended and restated bylaws may have an anti-takeover effect and may delay, defer or prevent a merger, acquisition, tender offer, takeover attempt or other change of control transaction that a shareholder might consider to be in its best interest, including those attempts that might result in a premium over the market price for the shares held by our shareholders.
These provisions provide for, among other things:
•a classified board of directors, as a result of which our board will be divided into three classes, with each class serving for staggered three-year terms;
•the ability of our board to issue one or more classes or series of preferred stock and to determine the preferences, rights and limitations of those shares without shareholder approval;
52
•advance notice requirements for nominations of directors and proposals of other business by shareholders to be considered at our annual or special meetings;
•at any time after WH Group ceases to own directly or indirectly a majority of the combined voting power of our then-outstanding shares of common stock entitled to vote generally in director elections (the “WHG Trigger Event”), our shareholders will not be able to act by less-than-unanimous written consent without a duly called annual or special meeting of our shareholders;
•at any time after the WHG Trigger Event, special meetings may only be called by the Chair of the board, the President or the board;
•from and after the WHG Trigger Event, our directors may only be removed for cause, by the affirmative vote of holders of a majority of the voting power of the shares of common stock outstanding and entitled to vote on the election of directors;
•restrictions on engaging in mergers, share exchanges, certain dispositions of corporate assets and other transactions with an interested shareholder (generally defined as any person, other than any member of WH Group or any entity that acquires a majority of our then outstanding shares of common stock directly from any member of WH Group that is a shareholder of our company, that acquires more than 10% of any class of our outstanding voting shares without the approval of a majority of our disinterested directors) unless the transaction is approved by a majority of our disinterested directors and holders of two-thirds of our voting shares (excluding shares owned by the interested shareholder); and
•that our amended and restated articles of incorporation and amended and restated bylaws may be amended by the affirmative vote of the holders of at least a majority of the total voting power of the outstanding shares of common stock entitled to vote.
These anti-takeover provisions could make it more difficult for a third party to acquire us, even if the third party’s offer may be considered beneficial by many of our shareholders. These provisions also may have the effect of preventing changes in our board and may make it more difficult to accomplish transactions that shareholders may otherwise deem to be in their best interests. As a result, our shareholders may be limited in their ability to obtain a premium for their shares.
Our board is authorized to issue and designate shares of our preferred stock in additional classes and series without shareholder approval.
Our amended and restated articles of incorporation authorizes our board, without the approval of our shareholders, to issue up to 100,000,000 shares of our preferred stock, subject to limitations prescribed by applicable law and the provisions of our amended and restated articles of incorporation, in one or more classes or series, to establish from time to time the number of shares to be included in each such class or series and to fix the preferences, rights and limitations of the shares of each such class or series. The preferences, rights and limitations of these classes or series of preferred stock may be senior to or on parity with our common stock, which may reduce the value of our common stock.
Our amended and restated bylaws designate the U.S. District Court for the Eastern District of Virginia, Richmond Division (or if it does not have jurisdiction over certain action, the Circuit Court of Henrico County, Virginia) as the sole and exclusive forum for certain litigation that may be initiated by our shareholders, which could limit our shareholders’ ability to obtain a favorable judicial forum for disputes with us.
Pursuant to our amended and restated bylaws, unless we consent in writing to the selection of an alternative forum, the U.S. District Court for the Eastern District of Virginia, Richmond Division (or, if the U.S. District Court for the Eastern District of Virginia does not have jurisdiction over certain action, the Circuit Court of Henrico County) is the sole and exclusive forum for (1) any derivative action or proceeding brought on behalf of our company, (2) any action asserting a claim of breach of a duty owed by any of our directors, officers or shareholders to us or our shareholders, (3) any action asserting a claim arising pursuant to the Virginia Stock Corporation Act, our amended and restated articles of incorporation or our amended and restated bylaws or (4) any action asserting a claim
53
governed by the internal affairs doctrine. Our amended and restated bylaws provide that the foregoing provision will not apply to claims arising under the Securities Act or the Exchange Act or any other claim for which the federal courts have exclusive jurisdiction. In addition, our amended and restated bylaws provide that, unless we consent in writing to the selection of an alternative forum, the federal district courts of the U.S. shall, to the fullest extent permitted by law, be the sole and exclusive forum for the resolution of any complaint asserting a cause of action arising under the Securities Act. There is no guarantee that a court will enforce such provisions. Section 22 of the Securities Act creates concurrent jurisdiction for federal and state courts over all claims brought to enforce any duty or liability created by the Securities Act or the rules and regulations thereunder. For the avoidance of doubt, our shareholders cannot waive compliance with U.S. federal securities laws and the rules and regulations thereunder. The forum selection clause in our amended and restated bylaws may have the effect of discouraging lawsuits against us or our directors, officers or shareholders.
Any person or entity purchasing or otherwise acquiring or holding any interest in shares of our capital stock will be deemed to have notice of and consented to the forum provisions in our amended and restated bylaws, except our shareholders will not be deemed to have waived (and cannot waive) compliance with the federal securities laws and the rules and regulations thereunder. This exclusive forum provision may limit a shareholder’s ability to bring a claim in a judicial forum that it finds favorable for disputes with us or any of our current or former directors, officers or shareholders. There is also a risk that this exclusive forum provision may result in increased costs for a shareholder to bring a claim. Alternatively, if a court were to find the exclusive forum provision contained in our amended and restated bylaws to be inapplicable or unenforceable in an action, we may incur additional costs associated with resolving such action in other jurisdictions, which could harm our business, financial condition and results of operations.
ITEM 1B. UNRESOLVED STAFF COMMENTS
None.
ITEM 1C. CYBERSECURITY DISCLOSURE
Risk Management and Strategy
We acknowledge the significance of cybersecurity in protecting our operations, data, and shareholders’ interests, and have made cybersecurity a fundamental component of our overall risk management framework. Our cybersecurity program is based on the National Institute of Standards and Technology (“NIST”) Cybersecurity Framework. This framework guides our efforts to protect critical assets, identify potential threats, respond to incidents, and strengthen resilience, while simultaneously allowing us to assess and enhance the maturity of our program. The cybersecurity program is informed by our Enterprise Risk Management (“ERM”) process and relies on internal and external expertise. We proactively evaluate and refine our security controls by utilizing best practices and threat intelligence to mitigate cyber risks. The Company also utilizes third parties for some cybersecurity services, including managed security services, external penetration testing, and social engineering tests. Additionally, we maintain an incident response plan that aligns with industry standards to ensure timely detection, containment, and remediation of security incidents.
Cybersecurity Program Components
Our cybersecurity program includes a focus on governance, process, technology and people. Key components include prevention, detection, and response capabilities, employee training programs, threat intelligence monitoring, and the implementation of an array of technologies. For example, to effectively manage cybersecurity risks, we maintain an asset inventory and classify critical systems to ensure appropriate protection measures. Our risk management processes include regular assessments of internal and third-party risks, which are aligned with our ERM strategy. We enforce cybersecurity policies, standards, and governance practices, ensuring they align with regulatory requirements and industry best practices. Additionally, we conduct periodic business impact analyses to strengthen resilience and inform risk-based decision-making.
The cybersecurity program incorporates multiple layers of security controls to safeguard our systems and data. Access controls are established based on the principle of least privilege, and all employees engage in cybersecurity
54
awareness training to cultivate a security-conscious culture. We train our employees through periodic security training, phishing simulations and regular communications about timely security topics to enhance their understanding of cybersecurity threats and their ability to identify and escalate potential cybersecurity events. We maintain robust security configuration management and regularly update systems to minimize vulnerabilities. Investments in security technology include vulnerability management tools, malicious software protection, email security, and around-the-clock monitoring.
Our cybersecurity team continuously monitors network activity using advanced threat detection tools. Through automated alerts, behavioral analytics, and threat intelligence, security anomalies are identified in a timely manner. Routine vulnerability scanning and independent penetration testing further enhance our ability to detect weaknesses before they can be exploited.
We have an established incident response plan that aligns with NIST guidelines, ensuring a structured approach to identifying, containing, eradicating, and recovering from security incidents. The plan includes defined escalation procedures to engage executive leadership and regulatory authorities as necessary. Our cybersecurity team conducts regular incident response exercises to enhance response readiness. Additionally, we have a process in place to perform post-incident reviews to refine processes and prevent recurrence.
Recovery strategies are in place and supervised by a crisis management plan to restore critical operations following a cybersecurity event. We maintain secure, redundant backups and regularly test them for integrity and availability. Our recovery strategies prioritize minimizing downtime and rapid service restoration. We strive to incorporate lessons learned from past incidents, strengthening our resilience against future threats.
Impact of Cybersecurity Risks and Threats
Governance
Our Board of Directors has delegated oversight of the Company’s ERM program, including cybersecurity, to the Audit Committee. The Audit Committee receives updates from our Senior Vice President, Information Technology (“SVPIT”) and members of our Information Technology Security Services Department regarding our enterprise-wide cybersecurity programs at least on a quarterly basis. These updates may address data management and security initiatives, significant existing and emerging cybersecurity risks, and any material cybersecurity incidents and their impact on the Company and its stakeholders.
Management
55
ITEM 2. PROPERTIES
The table below summarizes information about our owned and leased properties as of February 28, 2025:
| Number of Facilities | ||||||||||||||||||||||||||||||||||||||
| Segment/Type of Facilities | Owned | Leased | Total |
State (5)
|
Capacity
(in thousand)
|
Unit of Measurement |
||||||||||||||||||||||||||||||||
Packaged Meats (1)
|
||||||||||||||||||||||||||||||||||||||
| Production | 29 | 2 | 31 | Georgia (1), Iowa (5), Illinois (2), Indiana (1), Kansas (2), Kentucky (2), Massachusetts (1), Minnesota (1), Missouri (2), North Carolina (3), Nebraska (3), New Jersey (1), Ohio (2), Pennsylvania (1) , South Dakota (1), Tennessee (1), Virginia (1), Wisconsin (1) | 13,100 | Daily production lbs. | ||||||||||||||||||||||||||||||||
Fresh Pork (1)
|
||||||||||||||||||||||||||||||||||||||
| Processing | 8 | — | 8 | Iowa (2), Illinois (1), Missouri (1), Nebraska (1), North Carolina (2), South Dakota (1) | 107.9 | Head of hogs daily | ||||||||||||||||||||||||||||||||
| Other | 5 | 1 | 6 | Iowa (2), North Carolina (2), Utah (1), Virginia (1) | 2,500 | Daily production lbs. | ||||||||||||||||||||||||||||||||
| Hog Production | ||||||||||||||||||||||||||||||||||||||
Farms (3)
|
260 |
1,384 |
(2) |
1,644 |
Colorado (26), Iowa (410), Illinois (15), Missouri (204), North Carolina (875), Oklahoma (11), South Carolina (28), South Dakota (9), Utah (23), Virginia (43) |
11,500 | Hogs annually | |||||||||||||||||||||||||||||||
| Feed facilities | 26 |
25 |
51 | Colorado (1), Iowa (3), Indiana (1), Kansas (1), Missouri (9), North Carolina (26), Ohio (2), South Carolina (5), Utah (1), Virginia (2) | 708.4/32.9 |
Capacity in tons of feed storage / daily feed production | ||||||||||||||||||||||||||||||||
| Distribution Network | ||||||||||||||||||||||||||||||||||||||
Distribution Centers (4)
|
2 | 3 | 5 | Indiana (1), Kansas (1), Maryland (1), Nebraska (1), North Carolina (1) | 201.0 |
Pallet capacity | ||||||||||||||||||||||||||||||||
56
| Number of Facilities | ||||||||||||||||||||||||||||||||||||||
| Segment/Type of Facilities | Owned | Leased | Total |
State (5)
|
Capacity
(in thousand)
|
Unit of Measurement |
||||||||||||||||||||||||||||||||
| Direct-to-Store Delivery Facilities | 6 | 7 |
13 | Indiana (3), Kentucky (1), Maryland (1), Michigan (2), Ohio (3), Pennsylvania (1), Texas (3) |
152.1 |
Square feet | ||||||||||||||||||||||||||||||||
| Other | ||||||||||||||||||||||||||||||||||||||
| Mexico | ||||||||||||||||||||||||||||||||||||||
| Fresh Pork Processing | 1 | — | 1 | Puebla, MX | 5.0 |
Head of hogs daily | ||||||||||||||||||||||||||||||||
| Farms | 115 | 6 |
(2) |
121 | Puebla (79), Veracruz (42), MX | 1,800 | Hogs annually | |||||||||||||||||||||||||||||||
| Corporate | 1 | Puebla, MX | 13.3 |
Square feet | ||||||||||||||||||||||||||||||||||
| Bioscience | 1 | — | 1 | Ohio | 34.5 | Square feet | ||||||||||||||||||||||||||||||||
| U.S. Administrative | ||||||||||||||||||||||||||||||||||||||
| Headquarters | 1 | — | 1 | Virginia | 132.3 | Square feet | ||||||||||||||||||||||||||||||||
| Satellite offices | 1 | 3 | 4 | Illinois (1), Missouri (1), North Carolina (1), Virginia (1) | 135.2 | Square feet | ||||||||||||||||||||||||||||||||
| Sales offices | — | 5 | 5 | Idaho (1), Ohio (1), Michigan (1) California (1), Arkansas (1) | 32.0 |
Square feet | ||||||||||||||||||||||||||||||||
________________
(1)Certain of our fresh pork facilities are co-located with packaged meats production facilities. They are counted separately under each segment heading. We operate a total of 39 facilities that process fresh pork and packaged meats in the U.S.
(2)Consists of contract farms.
(3)Does not include a limited number of inactive farms.
(4)Distribution centers serve both our Packaged Meats and Fresh Pork segments. We also have access to over 45 cold storage locations via contractual arrangements with third parties. Our contracts are either pay-for-use or commit us to a specific annual amount irrespective of usage.
(5)Numbers in parentheses represent total number of facilities for each jurisdiction.
57
The map below shows the expansive footprint of our facilities and properties:
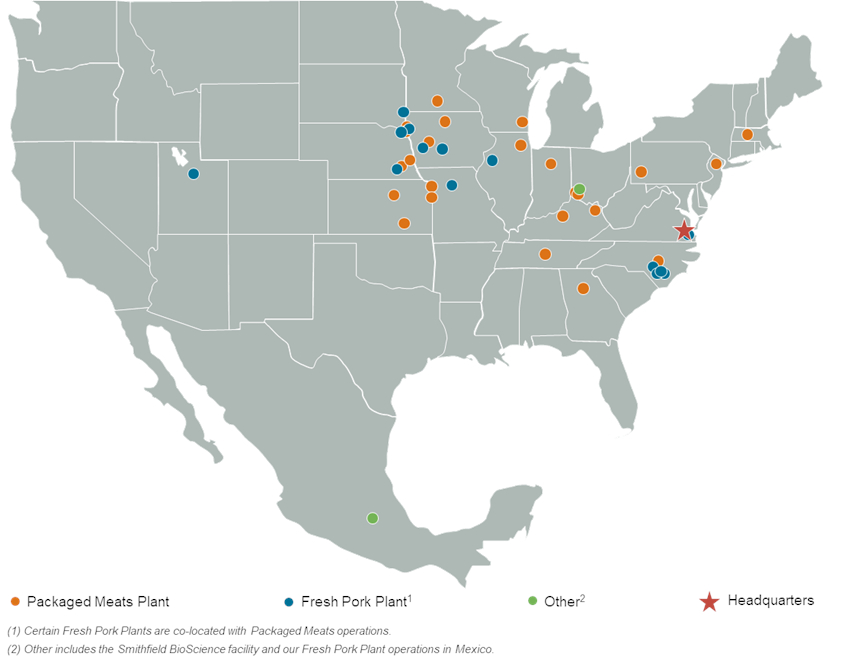
ITEM 3. LEGAL PROCEEDINGS
The information called for by this item is incorporated herein by reference to “Note 18: Commitments and Contingencies” to the consolidated financial statements included in Part II, Item 8 of this Annual Report.
ITEM 4. MINE SAFETY DISCLOSURES
Not applicable.
PART II
ITEM 5. MARKET FOR REGISTRANT’S COMMON EQUITY, RELATED STOCKHOLDER MATTERS AND ISSUER PURCHASES OF EQUITY SECURITIES
Market Information
On January 28, 2025, our common stock began trading on the Nasdaq Global Select Market under the symbol “SFD.” Prior to that, there was no public market for our common stock. Smithfield is a majority-owned subsidiary of Hong Kong-based WH Group. WH Group is listed on the Hong Kong Exchange.
58
Holders
As of March 5, 2025, there were approximately two record holders of the Company’s common stock and approximately 5,995 holders whose shares were held in street name by brokerage firms and financial institutions.
Issuer Purchases of Equity Securities
None.
Dividends
We have historically paid dividends to WH Group annually, along with special dividends in some years. On March 24, 2025, our Board declared a quarterly cash dividend of $0.25 per share of common stock, which is payable on April 22, 2025, to shareholders of record on April 10, 2025. We anticipate the remaining quarterly dividends in fiscal 2025 will be $0.25 per share, resulting in an annual dividend rate in fiscal 2025 of $1.00 per share. The declaration of dividends is subject to the discretion of our Board and depends on various factors, including our net income, financial condition, cash requirements, business prospects, and other factors that our Board deems relevant to its analysis and decision making.
Securities Authorized for Issuance under Equity Compensation Plans
For information relating to securities authorized for issuance under equity compensation plans, see Part III, Item 12 of this Form 10-K.
Use of Proceeds
On January 21, 2025, our Registration Statement on Form S-1, as amended (File 333-284141), was declared effective. On January 29, 2025, we completed our IPO of 26,086,958 shares of common stock, which represents 7% of the total outstanding shares, at a price of $20.00 per share. We issued 13,043,479 shares of common stock bringing the total number of outstanding shares to 393,112,711. The remaining 13,043,479 shares of common stock were sold by our existing shareholders. Our existing shareholder granted the underwriters a 30-day option to purchase up to 3,913,042 additional shares of our common stock. On February 20, 2025, the underwriters partially exercised such option and purchased 2,506,936 additional shares of common stock from our existing shareholder. The acting representatives for the underwriters were Morgan Stanley & Co. LLC, BofA Securities, Inc. and Goldman Sachs & Co.LLC.
We received net proceeds from the IPO of approximately $236 million after deducting underwriting discounts, commissions and fees of $13 million. Upon receipt, the net proceeds from the initial public offering were held in cash and cash equivalents and marketable securities. There has been no material change in the planned use of proceeds from our IPO from that described in our Prospectus on Form 424B4, filed with the SEC on January 29, 2025.
Shareholder Return Performance Graph
Not applicable.
ITEM 6. RESERVED
59
ITEM 7. MANAGEMENT’S DISCUSSION AND ANALYSIS OF FINANCIAL CONDITION AND RESULTS OF OPERATIONS
The following discussion and analysis of our financial condition and results of operations should be read in conjunction with the consolidated financial statements and accompanying notes included in Part II, Item 8 of this Annual Report on Form 10-K. This discussion and analysis includes the results of operations and financial conditions, including year-over-year comparisons, for fiscal years 2024 and 2023. For discussion and analysis of fiscal year 2022, including a year-over-year comparison of fiscal years 2023 and 2022, see “Management’s Discussion and Analysis of Financial Condition and Results of Operations” of our final prospectus, dated January 27, 2025, for our IPO, filed with the SEC under Rule 424(b) of the Securities Act on January 29, 2025. The information reflects all normal recurring adjustments which we believe are necessary to present fairly the financial position and results of operations for all periods included. Totals and percentages may be affected by rounding. Certain prior period amounts have been reclassified to conform to the current period presentation.
Overview
We are an American food company that employs approximately 34,000 people in the U.S. and 2,500 people in Mexico. We boast a portfolio of high-quality, iconic brands, such as Smithfield®, Eckrich® and Nathan’s Famous®, among many others. We are a majority owned subsidiary of Hong Kong-based WH Group.
We conduct our operations through three reportable segments: Packaged Meats, Fresh Pork, and Hog Production. We also conduct operations that do not constitute reportable segments, which include our Mexico and Bioscience operations.
Our fiscal year is the 52-week or 53-week period which ends on the Sunday nearest to December 31. Fiscal years 2024 and 2023 each consisted of 52-weeks.
For a more comprehensive overview of our company and operations, refer to “Item 1. Business” in this Annual Report on Form 10-K.
Growth Strategies
The strategic initiatives we are executing across our segments are complemented and enabled by our strong balance sheet and ongoing operational investments, positioning us for future growth. We have several strategic initiatives to grow our business, reduce costs and enhance our profitability and margins. These include:
•driving growth in our Packaged Meats segment;
•further enhancing the profitability of our Fresh Pork segment;
•continuing to invest in innovation;
•optimizing operational and supply chain efficiencies; and
•executing synergistic and complementary mergers and acquisitions.
For a more comprehensive discussion of our growth strategies, refer to “Item 1. Business—Our Growth Strategies” in this Annual Report on Form 10-K.
Key Factors Affecting Our Results of Operations and Financial Condition
The following are key factors that have influenced our results of operations in the past and may influence our results in the future.
Sales Drivers
We are focused on driving profitable growth through our Packaged Meats segment. Within the Packaged Meats segment, the primary factors impacting sales of our brands are household penetration, consumption levels, price
60
point and product offerings. As a result, we have pursued strategies that we believe best align our products with consumer trends and behavior. We have shifted our portfolio towards a higher mix of value-added and margin accretive products while leveraging the breadth of our offerings to further penetrate across dayparts. We look to increase brand awareness and encourage consumer adoption of our products through product and packaging innovation and effective and appealing marketing strategies while maintaining our promise to consumers to offer high-quality products for every budget. We have also expanded to new categories and grown distribution of under-indexed brands in under-penetrated locations. In addition to the prior initiatives, we also seek to increase sales in packaged meats products by driving volumes of our private label and foodservice products, by expanding our customer relationships and by offering quality selections across the value chain.
The U.S. packaged meats market is supported by long-term secular tailwinds, including consumer demand for high-protein diets, high-quality nutrition, product versatility and convenience. We expect these tailwinds to continue to drive increases in overall meat consumption. Nevertheless, changes in market trends and consumer preferences could adversely affect our results of operations.
In our Fresh Pork segment, the primary drivers of external sales are the consistent level of global pork consumption, our ability to maximize the value of each hog and our ability to leverage our different end markets including retail, foodservice, industrial and export channels. Through ongoing product innovation, we seek to appeal to ever-changing consumer preferences, including demand for convenience and smaller portion sizes as well as expanded interests in new and varied flavors. We also seek to capitalize on export markets as an outlet for increasing the value of raw materials through whole-hog utilization and by appealing to differentiated, global tastes and preferences.
Cost Factors
Our cost as a percentage of sales varies based on fluctuations of raw materials prices, as well as manufacturing, distribution and marketing costs. Raw materials are the largest component of our total cost of goods sold, with feed ingredients and hogs accounting for the majority share. Approximately 80% of the raw materials used in the Packaged Meats segment is sourced internally from our Fresh Pork segment, and about half of the hogs used in the Fresh Pork segment are supplied by our Hog Production segment. In the Hog Production segment, in fiscal year 2024, approximately 60% of cost of goods sold was from animal feed, which is derived primarily from corn and soybean meal. The price of feed ingredients, hogs and pork fluctuates based on market dynamics which can affect our margins. We enter into hedging transactions for these commodities when we determine conditions are appropriate to mitigate the inherent price risks. While this hedging may limit our ability to participate in gains from favorable commodity fluctuations, it also reduces the risk of loss from adverse changes in raw material prices.
We continue to optimize the size of our hog production operations and procure a greater mix of hogs from independent suppliers with market-based supply agreements in order to supply our Fresh Pork segment. We have reduced the size of our internal hog production from a peak of 17.6 million head in 2019 to 14.6 million head in 2024, and we continue to explore opportunities for reduced internal production. We expect to produce approximately 11.5 million head in 2025, which would represent approximately 40% of the hogs processed by our Fresh Pork segment.
We are pursuing best-in-class manufacturing principles in our plants by employing automation to redeploy labor to higher value tasks, increasing yields and driving efficiency by reducing complexity. In our logistics and distribution network, we have reduced transportation and warehousing costs by improving transportation carrier mix, maximizing utilization of our cold storage and trucking assets, improving supply and demand planning and optimizing inventory levels.
Our results of operations will continue to depend on our ability to (1) manage raw material cost movements through optimizing our hog production operations, hedging, forward purchasing, strategic sourcing negotiations and passing inflationary cost increases to customers, (2) operate our manufacturing and logistics footprint efficiently and competitively and (3) continue to attract and retain customers and consumers through effective sales and marketing spend.
61
Tariffs
We export our products to over 30 countries, including China, Mexico and Canada, and we are engaged in a joint venture in Mexico. For the year ended December 29, 2024, U.S. export sales accounted for 13% of our total sales.
Because of the growing market share of U.S. pork products in the international markets, U.S. exporters are increasingly being affected by measures taken by importing countries to protect local producers. Our international sales and operations are subject to various risks related to economic or political uncertainties, including, but not limited to, the risks posed by the imposition of tariffs, quotas, trade barriers and other trade protection measures that may be taken by various countries.
In February 2025, the current U.S. administration issued executive orders announcing a 10% tariff on most imported goods from China and 25% tariffs on most imported goods from Mexico and Canada. The China tariff went into effect on February 4, 2025 and the tariffs on Mexico and Canada went into effect on March 4, 2025. The China tariff was increased by an additional 10% effective March 4, 2025. However, on March 6, 2025, President Trump announced that the proposed tariffs on imported goods from Canada and Mexico that are covered by the United States-Mexico-Canada Agreement will be suspended until April 2, 2025.
China responded by imposing an additional 15% tariff on U.S. chicken, wheat, corn and cotton products and an additional 10% tariff on pork, among other products, increasing the tariff rate on pork from 37% to 47%. Officials from Mexico and Canada have announced that they anticipate imposing retaliatory tariffs.
Our primary raw materials, including hogs, feed grains and meat, are sourced primarily in the U.S. Tariffs imposed on U.S. exports of these items could increase U.S. supplies of these items and therefore, reduce our raw material costs. On the other hand, the U.S. pork industry depends on free and open export markets to support growth. China, Mexico and Canada are three of our largest export markets. Tariffs imposed on U.S. pork exports could increase U.S. pork supplies, which would also affect the price of pork in the U.S. We could also experience a decrease in demand or lose customers due to anti-American sentiment. Any of the above could materially affect our business, financial condition and results of operations.
Recent Developments
The following events and transactions have had, and/or will have, an impact on our results of operations and/or financial condition:
Initial Public Offering. On January 29, 2025, we completed our IPO of 26,086,958 shares of common stock, which represents 7% of the total outstanding shares, at a price of $20.00 per share. We issued 13,043,479 shares of common stock bringing the total number of outstanding shares to 393,112,711. The remaining 13,043,479 shares of common stock were sold by our existing shareholder. Our existing shareholder granted the underwriters a 30-day option to purchase up to 3,913,042 additional shares of our common stock. On February 20, 2025, the underwriters partially exercised such option and purchased 2,506,936 additional shares of common stock from our existing shareholder. We received net proceeds from the IPO of approximately $236 million after deducting underwriting discounts, commissions and fees. As a result of the IPO, our common stock is listed on the Nasdaq Global Select Market under the ticker “SFD.”
In connection with the IPO, we granted to our directors and certain of our employees and certain directors and employees of WH Group:
•options to purchase 9,822,467 shares with an exercise price equal to the IPO price and an aggregate grant date fair value of $30 million; and
•1,527,000 restricted stock units (“RSUs”) with an aggregate grant date fair value of $31 million.
Both the options and RSUs vest over a five year period, with 20% vesting each year. We expect to recognize an aggregate of $49 million in compensation expense over the five-year vesting period of these awards, of which we estimate that the amount recognized in 2025 will be $9 million.
62
Altoona, Iowa Facility Closure. On August 30, 2024, we closed our Altoona, Iowa ham boning facility and consolidated production volume into other locations to improve manufacturing efficiencies. Costs associated with closing the plant primarily include operating lease assets and equipment that we disposed of prior to the expiration of the lease term or end of the asset’s useful life. The charges associated with the closing were not material. Altoona was accounted for in the Fresh Pork segment.
European Carve-Out. On August 26, 2024, we completed a carve-out and transfer of our European operations to WH Group. As a result, we derecognized the assets and liabilities of our former European operations through equity. No gain or loss was recognized on the transaction. The historical results of operations, assets and liabilities, and cash flows of the European operations have been condensed and reported as discontinued operations in the consolidated financial statements for all periods presented.
Dry Sausage Facility Acquisition. On July 30, 2024, we acquired a dry sausage production facility located in Nashville, Tennessee from Cargill Meat Solutions Corporation for $38 million. The acquisition is part of our strategy to grow our value-added packaged meats business and serve the growing demand for high-quality pepperoni, salami, charcuterie and other dry sausage products.
Employee Retention Tax Credit. In the second quarter of 2024, we recognized $86 million and $1 million of employee retention credits in cost of sales and selling, general and administrative expenses (“SG&A”), respectively, in the consolidated statement of income. For more information, see “Note 7: Employee Retention Tax Credits” to the consolidated financial statements included in Part II, Item 8 of this Annual Report.
American Skin. On December 28, 2023, we acquired the remaining 15% interest in American Skin Food Group, LLC for $15 million.
West Coast Exit and Hog Production Reform. We have undertaken a number of steps to exit our operations in California where high taxes, high utility costs and a challenging regulatory environment negatively impact our ability to operate efficiently and profitably. We also undertook a number of other actions in furtherance of our efforts to optimize the size of our Hog Production segment’s operations and improve its cost structure:
•West Coast Exit. In May 2022, we announced a decision to close our Vernon, California processing facility, exit farm operations in Arizona and California and reduce our sow herd in Utah. Additionally, in December 2023, we made a decision to terminate a number of agreements with contract farmers and closed several company-owned nursery farms in Utah as a result of the Vernon, California facility closure in early fiscal year 2023.
•Hog Production Reform. We have taken the following actions to further restructure and optimize the size of our hog production operations, including:
•In May 2023, we made a decision to cease operations on a number of sow farms in Missouri. The decision was driven by persistent livestock disease issues, underperforming operations and shifting industry supply and demand dynamics.
•In fiscal years 2023 and 2024, we terminated certain agreements with underperforming contract farmers and closed certain farms in the eastern U.S.
•On December 27, 2024, we became a member of a North Carolina-based company, Murphy Family Farms, by contributing $3 million in cash in exchange for a 25% minority interest. We additionally sold approximately 150,000 sows and related inventories located on company-owned and contract farms in North Carolina to Murphy Family Farms and recorded a gain of $6 million on the sale. Subsequent to the end of fiscal year 2024, on December 30, 2024, we sold the commercial hog inventories associated with such sows to Murphy Family Farms. Murphy Family Farms is now a hog supplier to us and will supply approximately 3.2 million hogs annually. We will supply animal feed and other supplies and provide certain support services to Murphy Family Farms.
63
•On February 24, 2025, we became a member of a North Carolina-based company, VisionAg, by contributing $450,000 in cash in exchange for a 9% minority interest. We additionally sold approximately 28,000 sows and the associated commercial hog inventories located on certain company-owned and contract farms in North Carolina to VisionAg. VisionAg is now a hog supplier to us and will supply approximately 600,000 hogs annually. In addition, we will supply animal feed and provide certain support services to VisionAg.
As a result of these decisions, we incurred various exit costs and disposal charges. We recognized charges totaling $31 million and $195 million in cost of sales in fiscal years 2024 and 2023, respectively. Included in the $31 million of charges recognized in fiscal year 2024 was a $4 million loss on the sale of certain hog farms in Missouri from which we received $32 million in proceeds.
Additionally, in the fourth quarter of 2023, certain biogas assets owned by our joint venture, Align, were impaired as a result of our decision in December 2023 to terminate hog grower contracts and close farms in Utah. As a result, we recognized our share of the impairment totaling $35 million in (income) loss from equity method investments in the consolidated income statement. Also in the fourth quarter of 2023, we incurred $14 million in costs associated with biogas assets owned by our joint venture, Monarch, in connection with the farms in Missouri that were closed in fiscal year 2023. These costs were recognized in (income) loss from equity method investments in the consolidated statement of income.
In the second quarter of 2023, we sold our Vernon, California facility for $205 million and recognized a gain of $86 million in operating gains in the consolidated statement of income.
On December 17, 2024, we sold our hog production assets in Utah, excluding the live animals, for $58 million. The transaction resulted in a gain of $32 million, which was recognized in operating gains in the consolidated statement of income in the fourth quarter of 2024. As part of the agreement, we leased back certain farm and feed properties that we continue to operate.
Results of Operations
Consolidated Results of Continuing Operations
| Fiscal Year | ||||||||||||||||||||
| 2024 | 2023 | $ Change | ||||||||||||||||||
| (in millions) | ||||||||||||||||||||
| Sales | $ | 14,142 | $ | 14,640 | $ | (498) | ||||||||||||||
| Cost of sales | 12,244 | 13,751 | (1,507) | |||||||||||||||||
| Gross profit | 1,897 | 889 | 1,008 | |||||||||||||||||
| Selling, general and administrative expenses | 840 | 1,050 | (211) | |||||||||||||||||
Operating gains |
(60) | (105) | 45 | |||||||||||||||||
| Operating profit (loss) | 1,118 | (56) | 1,174 | |||||||||||||||||
| Interest expense, net | 66 | 76 | (10) | |||||||||||||||||
| Non-operating gains | (9) | (3) | (6) | |||||||||||||||||
| Income (loss) from continuing operations before income taxes | 1,061 | (129) | 1,189 | |||||||||||||||||
| Income tax expense (benefit) | 271 | (41) | 312 | |||||||||||||||||
| (Income) loss from equity method investments | (8) | 46 | (53) | |||||||||||||||||
| Net income (loss) from continuing operations | 798 | (133) | 930 | |||||||||||||||||
| Net income from continuing operations attributable to noncontrolling interests | 14 | 5 | 9 | |||||||||||||||||
Net income (loss) from continuing operations attributable to Smithfield |
$ | 783 | $ | (138) | $ | 921 | ||||||||||||||
64
Operating Profit (Loss) by Segment
| Fiscal Year | |||||||||||||||||
| 2024 | 2023 | $ Change | |||||||||||||||
| (in millions) | |||||||||||||||||
Packaged Meats |
$ | 1,168 | $ | 1,066 | $ | 102 | |||||||||||
Fresh Pork |
266 | 117 | 150 | ||||||||||||||
Hog Production |
(144) | (756) | 612 | ||||||||||||||
Other |
35 | (4) | 39 | ||||||||||||||
Corporate expenses |
(153) | (107) | (46) | ||||||||||||||
Unallocated |
(55) | (371) | 316 | ||||||||||||||
Operating profit (loss) |
$ | 1,118 | $ | (56) | $ | 1,174 | |||||||||||
We recently removed income from equity method investments from the measure of segment profit reviewed by our Chief Operating Decision Maker. Accordingly, the historical segment results presented herein have been retrospectively adjusted to remove income from equity method investments.
Results of Operations Analysis
The following discussion provides an analysis of our results of operations for fiscal year 2024 compared to fiscal year 2023.
Sales
| Fiscal Year | |||||||||||||||||||||||
| 2024 | 2023 | $ Change | % Change | ||||||||||||||||||||
| (in millions) | |||||||||||||||||||||||
| Sales by segment: | |||||||||||||||||||||||
| Packaged Meats | $ | 8,319 | $ | 8,280 | $ | 39 | 0.5 | % | |||||||||||||||
| Fresh Pork | 7,873 | 7,832 | 42 | 0.5 | % | ||||||||||||||||||
| Hog Production | 3,002 | 3,317 | (315) | (9.5) | % | ||||||||||||||||||
| Other | 471 | 559 | (88) | (15.7) | % | ||||||||||||||||||
| Total segment sales | 19,665 | 19,988 | (323) | (1.6) | % | ||||||||||||||||||
Inter-segment sales eliminations: |
|||||||||||||||||||||||
Fresh Pork |
(2,990) | (2,694) | (296) | 11.0 | % | ||||||||||||||||||
Hog Production |
(2,533) | (2,646) | 114 | (4.3) | % | ||||||||||||||||||
Other |
(1) | (7) | 6 | (90.0) | % | ||||||||||||||||||
| Total inter-segment sales eliminations | (5,524) | (5,348) | (176) | 3.3 | % | ||||||||||||||||||
| Consolidated Sales | $ | 14,142 | $ | 14,640 | $ | (498) | (3.4) | % | |||||||||||||||
Packaged Meats. Segment sales increased by $39 million, or 0.5%, as a 3.1% increase in average sales price more than offset a 2.5% decrease in sales volume. The increase in average sales price was primarily due to higher raw material costs, which translated into higher sales prices of our packaged meats products, as well as an improvement in product mix. The decrease in volume was mainly due to lower bacon sales associated with the group housing legislation in California and Massachusetts, which requires pork producers nationwide to comply with certain production standards in order to sell pork products into these states, and lower holiday ham sales.
Fresh Pork. Segment sales increased by $42 million, or 0.5%, as a 5.4% increase in our average sales price more than offset a 4.7% decrease in volume. The increase in our average sales price reflects strong demand for U.S. pork, which was supported by higher relative prices for competing proteins and strength in export markets. In fiscal year
65
2024, fresh pork cut-out values reported by the USDA averaged $0.96 per pound, up 6.5% from fiscal 2023. The decrease in Fresh Pork volume was largely due to a strategic plan to optimize production levels.
Hog Production. Segment sales decreased by $315 million, or 9.5%, largely due to an 7.8% decrease in the number of hogs sold and a $171 million decrease in grain sales, partially offset by a 6.2% increase in our average hog sales price, including the effects of hedging. The decrease in the number of hogs sold by the segment was largely attributable to Hog Production Reform activities aimed at reducing the number of hogs we produce.
Other. Segment sales decreased by $88 million, or 15.7%, predominantly attributable to our Mexico operations due in part to an 8.3% decline in volume.
Inter-segment Eliminations
•Fresh Pork. The increase in inter-segment sales by our Fresh Pork segment was attributable to higher market values for fresh pork components sold to our Packaged Meats segment.
•Hog Production. The decrease in inter-segment sales by our Hog Production segment was attributable to our Hog Production Reform activities, which reduced the number of hogs sold to our Fresh Pork segment, partially offset by an increase in the average sales price.
Cost of Sales
| Fiscal Year | |||||||||||||||||||||||
| 2024 | 2023 | $ Change | % Change | ||||||||||||||||||||
| (in millions) | |||||||||||||||||||||||
Packaged Meats |
$ | 6,759 | $ | 6,792 | $ | (33) | (0.5) | % | |||||||||||||||
Fresh Pork |
7,419 | 7,525 | (105) | (1.4) | % | ||||||||||||||||||
Hog Production |
3,104 | 4,024 | (920) | (22.9) | % | ||||||||||||||||||
Other |
412 | 536 | (125) | (23.3) | % | ||||||||||||||||||
Unallocated |
74 | 222 | (148) | (66.6) | % | ||||||||||||||||||
| Inter-segment eliminations | (5,524) | (5,348) | (176) | 3.3 | % | ||||||||||||||||||
Cost of sales |
$ | 12,244 | $ | 13,751 | $ | (1,507) | (11.0) | % | |||||||||||||||
Packaged Meats. Cost of sales in our Packaged Meats segment decreased by $33 million, or 0.5%, driven by the following factors, which more than offset a $75 million increase in raw material costs attributable to the net effect of higher meat prices and lower sales volume:
•A $71 million decrease in manufacturing and distribution costs primarily due to cost improvement initiatives and lower sales volume.
•The recognition of $38 million in employee retention tax credits in the second quarter of 2024.
Fresh Pork. Cost of sales in our Fresh Pork segment decreased by $105 million, or 1.4%, due to the following factors, which more than offset a $111 million increase in raw material costs driven by the net effect of higher market hog prices and lower sales volume:
•A $175 million decrease in manufacturing and distribution costs largely due to cost improvement initiatives and lower sales volume.
•The recognition of $41 million in employee retention tax credits in the second quarter of 2024.
Hog Production. Cost of sales in our Hog Production segment decreased by $920 million, or 22.9%, primarily due to the following factors:
•A $717 million decrease in raw material costs largely due to lower prices for feed ingredients, a reduction in the number of hogs produced and lower external grain sales.
66
•A $195 million decrease in operating costs largely attributable to the effects of our Hog Production Reform activities on both volume and cost improvements, as well as lower external grain sales.
•The recognition of $8 million in employee retention tax credits in the second quarter of 2024.
Other. Cost of sales in our Other segments decreased by $125 million, or 23.3%, which was primarily attributable to lower raw material costs in our Mexico operations driven by lower market prices for feed ingredients and lower sales volume.
Unallocated. The unallocated costs primarily represent costs associated with our West Coast Exit and Hog Production Reform activities.
Selling, General and Administrative Expenses
| Fiscal Year | |||||||||||||||||||||||
| 2024 | 2023 | $ Change | % Change | ||||||||||||||||||||
| (in millions) | |||||||||||||||||||||||
Packaged Meats |
$ | 394 | $ | 422 | $ | (28) | (6.7) | % | |||||||||||||||
Fresh Pork |
188 | 190 | (3) | (1.5) | % | ||||||||||||||||||
Hog Production |
42 | 50 | (8) | (15.9) | % | ||||||||||||||||||
Other |
24 | 26 | (2) | (8.2) | % | ||||||||||||||||||
| Unallocated | 38 | 254 | (215) | (84.9) | % | ||||||||||||||||||
Corporate expenses |
154 | 108 | 46 | 42.8 | % | ||||||||||||||||||
Selling, general, and administrative expenses |
$ | 840 | $ | 1,050 | $ | (211) | (20.1) | % | |||||||||||||||
SG&A decreased by $211 million, or 20.1%, primarily driven by the following factors, which more than offset a $44 million increase in variable compensation expenses attributable to the improvement in our results of operations (reflected primarily in corporate expenses):
•A $211 million decrease in accruals for litigation matters described in “Note 18: Regulation and Contingencies” to the consolidated financial statements included in Part II, Item 8. of this Annual Report. This decrease is reflected in unallocated expenses in the table above.
•A $27 million decrease in marketing and advertising expenses due to an increased focus on the effectiveness of our spending, largely attributable to our Packaged Meats and Fresh Pork segments.
•The impact of foreign exchange transactions, which decreased SG&A by $14 million. Gains and losses on foreign exchange transactions are included in unallocated expenses in the table above.
67
Operating Gains
Operating gains consists of the following items:
| Fiscal Year | |||||||||||
| 2024 | 2023 | ||||||||||
| (in millions) | |||||||||||
| Packaged Meats | $ | (2) | $ | — | |||||||
| Unallocated: | |||||||||||
Gain on disposal of assets (1)
|
(43) | (88) | |||||||||
Insurance recoveries |
(9) | (5) | |||||||||
| Other operating gains | (5) | (12) | |||||||||
Total operating gains |
$ | (60) | $ | (105) | |||||||
________________
(1)Fiscal year 2024 includes a $32 million gain on the sale of hog farms in Utah and a $6 million gain on the sale of assets to Murphy Family Farms. Fiscal year 2023 includes an $86 million gain on the sale of our Vernon, California plant.
Interest Expense, Net
Interest expense, net decreased by $10 million to $66 million from $76 million, or 13.1%, due to higher levels of cash and cash equivalents earning interest at higher rates in fiscal year 2024 as compared to fiscal year 2023, while interest rates on borrowings were largely fixed.
Non-operating Gains
Non-operating gains consists of the following items:
| Fiscal Year | |||||||||||
| 2024 | 2023 | ||||||||||
| (in millions) | |||||||||||
Gain on nonqualified retirement plan assets |
$ | (17) | $ | (15) | |||||||
Net pension and postretirement benefits cost (1)
|
10 | 10 | |||||||||
| Other | (2) | 1 | |||||||||
| Non operating gains | $ | (9) | $ | (3) | |||||||
________________
(1)Includes the components of net pension and postretirement benefits cost other than service cost, which is included in operating profit. These components consist of interest cost, expected return on plan assets, amortization of actuarial gains/losses and prior service costs/credits, and curtailment gains.
Income Tax Expense (Benefit)
Income tax expense (benefit) increased to an expense of $271 million in fiscal year 2024 from a benefit of $41 million in fiscal year 2023 primarily due to the significant pre-tax income recognized in fiscal year 2024, compared to a loss recognized in fiscal year 2023. The effective tax rate was 25.5% in fiscal year 2024 compared to 32.2% in fiscal year 2023. The impact of the reconciling items between the federal statutory rate and our effective tax rate were more pronounced in fiscal year 2023 largely due to the pre-tax loss of $129 million in fiscal year 2023 compared to pre-tax income of $1,061 million in fiscal year 2024. See “Note 13: Income Taxes” to the consolidated financial statements included in Part II, Item 8 of this Annual Report, for further information.
(Income) Loss from Equity Method Investments
(Income) loss from equity method investments increased to income of $8 million in fiscal year 2024 from a loss of $46 million in fiscal year 2023. Fiscal year 2023 included $49 million in impairments and other costs associated with our biogas joint ventures as a result of our West Coast Exit and Hog Production Reform actions.
68
Liquidity and Capital Resources
Our sources of liquidity include cash and cash equivalents on hand together with availability under our committed revolving credit facilities. As of December 29, 2024, we had $3,245 million of available liquidity consisting of $943 million in cash and cash equivalents and $2,303 million of availability under our committed credit facilities. Availability under our committed credit facilities is reduced by the principal amount of our outstanding commercial paper. We believe that our current liquidity position is strong and that our cash flows from operations and availability under our credit facilities will be sufficient to meet our working capital needs and financial obligations and commitments for at least the next twelve months.
Credit Facilities
| December 29, 2024 | ||||||||||||||||||||||||||||||||||||||
| Facility | Capacity | Borrowing Base Adjustment |
Outstanding
Borrowings
|
Commercial Paper Borrowings |
Outstanding Letters of Credit |
Amount Available |
||||||||||||||||||||||||||||||||
| (in millions) | ||||||||||||||||||||||||||||||||||||||
Senior Revolving Credit Facility |
$ | 2,100 | $ | — | $ | — | $ | — | $ | — | $ | 2,100 | ||||||||||||||||||||||||||
Securitization Facility |
225 | — | — | — | (22) | 203 | ||||||||||||||||||||||||||||||||
| Total credit facilities | $ | 2,325 | $ | — | $ | — | $ | — | $ | (22) | $ | 2,303 | ||||||||||||||||||||||||||
Senior Unsecured Revolving Credit Facility
In February 2025, we refinanced our $2,100 million senior unsecured revolving credit facility (“Senior Revolving Credit Facility”) extending the maturity date from May 21, 2027 to February 12, 2030. As part of the new agreement, there are no longer any subsidiary guarantors under the Senior Revolving Credit Facility which also released the subsidiary guarantors from our senior unsecured notes. The Senior Revolving Credit Facility bears interest at the SOFR plus a margin ranging from 0.875% to 1.50% per annum, or, at our election, at a base rate plus a margin ranging from 0.00% to 0.50% per annum, in each case depending on our senior unsecured debt ratings. The Senior Revolving Credit Facility also contains financial maintenance covenants requiring us to maintain a maximum total consolidated leverage ratio (ratio of consolidated funded debt to consolidated capitalization, each as defined in the Senior Revolving Credit Facility) of 0.50 to 1.00 (which we may elect to increase to 0.55 to 1.00 with respect to any fiscal quarter in which a material acquisition is consummated and the immediately following three consecutive fiscal quarters, subject to certain restrictions) and a minimum interest coverage ratio (ratio of EBITDA to Consolidated Interest Expense, each as defined in the Senior Revolving Credit Facility) of 3.50 to 1.00.
Our Senior Revolving Credit Facility contains customary covenants, including, but not limited to, restrictions on our ability and that of our subsidiaries to merge and consolidate with other companies, incur indebtedness, grant liens or security interests on assets subject to their security interest, make acquisitions, loans, advances or investments, pay dividends, sell or otherwise transfer assets, optionally prepay or modify terms of any junior indebtedness or enter into transactions with affiliates, each subject to certain exceptions as set forth therein. We are currently in compliance with the covenants under our Senior Revolving Credit Facility.
We have a commercial paper program, which is supported by the Senior Revolving Credit Facility, that provides access to a low-cost source of borrowing to fund general corporate purposes, including working capital. The maximum issuance capacity under our commercial paper program is $1,750 million. The maturity of commercial paper issued under the program varies but does not exceed 397 days from the date of issuance. Our ability to access the commercial paper market in the future is dependent on maintaining investment grade credit ratings and market conditions.
Accounts Receivable Securitization Facility
In November 2024, we refinanced our accounts receivable securitization facility (the “Securitization Facility”), which extended the maturity date to November 22, 2027, and reduced the borrowing capacity to $225 million. As part of the Securitization Facility, certain accounts receivable of our major domestic meat processing subsidiaries are
69
sold to a wholly owned “bankruptcy remote” special purpose vehicle (“SPV”). The SPV pledges all such accounts receivable not otherwise sold pursuant to the Monetization Facility (as defined below) as security for loans made, and letters of credit issued, by participating lenders under the Securitization Facility. The SPV is included in our consolidated financial statements and therefore the accounts receivable owned by it are included in our consolidated balance sheets. However, the accounts receivable owned by the SPV are separate and distinct from our other assets and are not available to our other creditors should we become insolvent. As of December 29, 2024, the SPV held $374 million of accounts receivable. We must maintain certain ratios related to the collection of our receivables as a condition of the Securitization Facility agreement. As of December 29, 2024, we had $22 million in letters of credit issued under the Securitization Facility. None of the letters of credit were drawn upon.
Under the Securitization Facility, we and the SPV, as applicable, are subject to certain customary covenants, including, but not limited to, restrictions on our ability to sell, assign or otherwise dispose of any collateral or assign any right to receive income with respect thereto, use proceeds for any purpose other than those set forth in the Securitization Facility, make certain payments on junior indebtedness, incur debt or merge or consolidate, subject to certain exceptions set forth therein. The SPV is also prohibited from issuing any LCR Security (as defined in the Securitization Facility agreement). We are currently in compliance with the covenants under the Securitization Facility.
Monetization Facility
In addition to the Securitization Facility, we maintain an uncommitted $250 million accounts receivable monetization facility (the “Monetization Facility”). At Smithfield’s election and subject to the purchasing banks’ approval, certain accounts receivable may be sold by the SPV to purchasing banks, so long as the uncollected outstanding amount of accounts receivable sold pursuant to the Monetization Facility does not exceed $250 million in the aggregate at any time, among other limitations. In the event of a sale, the purchasing banks assume all credit risk related to the receivables while we maintain risk associated with customer disputes. We account for the sale of receivables to a purchasing bank by derecognizing the receivables from our consolidated balance sheet upon transfer of control to the purchasing bank, and recognizing a discount on the sale in SG&A in the consolidated statement of income. The proceeds from the sale of receivables are included in net cash flows from operating activities in the consolidated statement of cash flows. On behalf of the purchasing banks, we continue to service all receivables sold under the Monetization Facility. As of December 29, 2024, the uncollected balance of receivables that had been sold to purchasing banks was $230 million. We had no servicing asset or liability outstanding as of December 29, 2024.
In the first quarter of fiscal year 2023, we sold $227 million of accounts receivable at a discount and received proceeds totaling $225 million. Subsequently, we reinvested $4,094 million and $3,431 million of cash collections from customers in the revolving sale of accounts receivable to purchasing banks in fiscal years 2024 and 2023, respectively. We recognized charges totaling $15 million and $12 million in fiscal years 2024 and 2023, respectively, attributable to the discount on the sale of accounts receivable in SG&A in the consolidated statement of income.
Cash Flows
Cash Flows From Operating Activities of Continuing Operations
70
| Fiscal Year | |||||||||||
| 2024 | 2023 | ||||||||||
| (in millions) | |||||||||||
| Net income | $ | 970 | $ | 23 | |||||||
| Less: Net income from discontinued operations | (172) | (155) | |||||||||
| Net income (loss) from continuing operations | $ | 798 | $ | (133) | |||||||
| Adjustments to reconcile net income from continuing operations to net cash flows from operating activities of continuing operations: | |||||||||||
| Depreciation and amortization | 339 | 427 | |||||||||
| Deferred income taxes | 91 | (130) | |||||||||
| Impairment of assets | 1 | 1 | |||||||||
| (Income) loss from equity method investments | (8) | 46 | |||||||||
| (Gain) loss on sale of other assets | 15 | 11 | |||||||||
| (Gain) loss on sale of property, plant and equipment | (35) | (85) | |||||||||
| Change in accounts receivable | (6) | 157 | |||||||||
| Change in inventories | 138 | 469 | |||||||||
| Change in prepaid expenses and other current assets | (88) | 57 | |||||||||
| Change in accounts payable | (19) | (215) | |||||||||
| Change in accrued expenses and other current liabilities | (261) | 80 | |||||||||
| Other | (49) | 2 | |||||||||
| Net cash flows from operating activities of continuing operations | $ | 916 | $ | 688 | |||||||
Net cash flows from operating activities of continuing operations increased by $228 million to $916 million in fiscal year 2024 from $688 million in fiscal year 2023. This increase was primarily driven by higher earnings and changes on deferred income taxes, partially offset by changes in working capital. The following describes the significant changes in working capital:
•Accounts receivable. Accounts receivable decreased in fiscal year 2023 primarily due to the monetization of receivables under the Monetization Facility.
•Inventories and accounts payable. Inventories and accounts payable decreased in fiscal year 2024 primarily due to lower commodity prices for feed grains and lower inventory volumes attributable to Hog Production reform decisions. Inventories and accounts payable decreased in fiscal year 2023 primarily due to lower inventory volumes largely attributable to the West Coast exit and Hog Production reform decisions as well as lower commodity prices for meat and feed grains.
•Prepaid expenses and other current assets. Prepaid expenses and other current assets increased in fiscal year 2024 largely due to an increase in income taxes receivable, which was primarily driven by a tax benefit recognized in connection with the carve-out of our European operations, and an increase in prepaid deposits for grain in Mexico. Prepaid expenses and other current assets decreased in fiscal year 2023 largely due to a decrease in an escrow balance related to a litigation settlement.
•Accrued expenses and other current liabilities. Accrued expenses and other current liabilities decreased in fiscal year 2024 largely due to payments related to litigation settlements and our West Coast exit and Hog Production reform activities. Accrued expenses and other current liabilities increased in fiscal year 2023 largely due to accruals for litigation and our West Coast exit and Hog Production reform activities, partially offset by litigation settlements.
71
Cash Flows From Investing Activities of Continuing Operations
| Fiscal Year | |||||||||||
| 2024 | 2023 | ||||||||||
| (in millions) | |||||||||||
| Capital expenditures | $ | (350) | $ | (353) | |||||||
| Net expenditures from breeding stock transactions | (43) | (48) | |||||||||
| Investments in partnerships and other assets | (13) | (27) | |||||||||
| Business dispositions | — | 13 | |||||||||
| Proceeds from sale of property, plant and equipment and other assets | 99 | 219 | |||||||||
| Other | 9 | 3 | |||||||||
Net cash flows used in investing activities of continuing operations |
$ | (298) | $ | (194) | |||||||
Net cash used in investing activities of continuing operations increased by $104 million to $298 million in fiscal year 2024 from $194 million in fiscal year 2023. The following items explain this increase and the significant cash flows from investing activities:
•Capital expenditures. Fiscal year 2024 includes $33 million for the purchase of a dry sausage production facility located in Nashville, Tennessee. The remaining capital expenditures for both fiscal years 2024 and 2023 consisted primarily of various plant expansion, automation and improvement projects.
•Investments in partnerships and other assets. We made capital contributions totaling $5 million and $21 million to our biogas joint ventures in fiscal years 2024 and 2023, respectively. Also, in fiscal year 2024, we became a member of, and contributed $3 million to, Murphy Family Farms.
•Business dispositions. In fiscal year 2023, we received a $7 million final settlement for the sale of a business in fiscal year 2022, $4 million for the sale of a retail business and a $2 million final settlement for the sale of hog farms in California.
•Proceeds from the sale of property, plant and equipment and other assets. In fiscal year 2024, we received $58 million and $32 million for the sale of hog farms in Utah and Missouri, respectively. In fiscal year 2023, we received $205 million in proceeds for the sale of our Vernon, California facility.
Cash Flows From Financing Activities of Continuing Operations
| Fiscal Year | |||||||||||
| 2024 | 2023 | ||||||||||
| (in millions) | |||||||||||
| Payment of dividends | $ | (288) | $ | (323) | |||||||
| Repayments to Securitization Facility | (14) | (226) | |||||||||
| Proceeds from Securitization Facility | 14 | 226 | |||||||||
| Purchase of redeemable noncontrolling interest | — | (15) | |||||||||
| Net repayments to revolving credit facilities | (8) | (7) | |||||||||
| Principal payments on long-term debt and finance lease obligations | (24) | (4) | |||||||||
Payment of deferred purchase consideration for acquisition |
(2) | (2) | |||||||||
| Other | 1 | (2) | |||||||||
Net cash flows used in financing activities of continuing operations |
$ | (321) | $ | (353) | |||||||
72
Net cash used in financing activities of continuing operations decreased by $32 million to $321 million in fiscal year 2024 from $353 million in fiscal year 2023. The following items explain certain significant cash flows from financing activities during the periods presented:
•Dividends. Dividends in fiscal year 2023 included a $100 million special dividend from the proceeds from the sale of our Vernon, California facility.
•Purchase of redeemable noncontrolling interest. In fiscal year 2023, we paid $15 million for the remaining 15% interest in American Skin.
Contractual Obligations and Commitments
Our cash requirements for long-term contractual obligations and commitments as of December 29, 2024 are presented in the following table:
| Due Date by Period | |||||||||||||||||||||||||||||||||||||||||
| 2025 | 2026 | 2027 | 2028 | 2029 | 2030 & thereafter | Total | |||||||||||||||||||||||||||||||||||
| (in millions) | |||||||||||||||||||||||||||||||||||||||||
Debt principal payments (1)
|
$ | — | $ | — | $ | 600 | $ | — | $ | 400 | $ | 1,000 | $ | 2,000 | |||||||||||||||||||||||||||
| Debt interest payments | 74 | 74 | 51 | 49 | 33 | 34 | 317 | ||||||||||||||||||||||||||||||||||
Guaranteed royalty payments (2)
|
15 | 15 | 16 | 16 | 16 | 34 | 112 | ||||||||||||||||||||||||||||||||||
Lease obligations (3)
|
73 | 59 | 47 | 36 | 27 | 217 | 460 | ||||||||||||||||||||||||||||||||||
Pension and other postretirement benefit obligations (4)
|
29 | — | — | — | — | — | 312 | ||||||||||||||||||||||||||||||||||
Commitments to investees (5)
|
— | — | — | — | — | — | 195 | ||||||||||||||||||||||||||||||||||
| Purchase commitments: | |||||||||||||||||||||||||||||||||||||||||
Hog procurement (6)
|
2,599 | 1,704 | 1,239 | 913 | 913 | 584 | 7,953 | ||||||||||||||||||||||||||||||||||
Contract hog growers (7)
|
141 | 78 | 69 | 55 | 37 | 108 | 488 | ||||||||||||||||||||||||||||||||||
Grain procurement (8)
|
179 | — | — | — | — | — | 179 | ||||||||||||||||||||||||||||||||||
Other |
83 | 19 | 17 | 15 | 16 | 209 | 359 | ||||||||||||||||||||||||||||||||||
Other long-term liabilities (9)
|
197 | ||||||||||||||||||||||||||||||||||||||||
| Total | $ | 3,194 | $ | 1,951 | $ | 2,039 | $ | 1,085 | $ | 1,443 | $ | 2,185 | $ | 12,571 | |||||||||||||||||||||||||||
________________
(1)In the event of default on a payment, acceleration of principal payments could occur.
(2)Represents guaranteed royalty payments to license the Nathan’s Famous brand.
(3)Amounts presented for lease obligations represent the undiscounted contractual lease payments for our operating and finance lease obligations. For more information on leases, see “Note 12: Lease Obligations, Commitments and Guarantees” to the consolidated financial statements included in Part II, Item 8 of this Annual Report.
(4)We historically provided the majority of our U.S. employees with pension benefits. Funding requirements for our pension plans are determined based on the funded status measured at the end of each year. The values of our pension obligation and related assets may fluctuate significantly, which may in turn lead to a larger underfunded status in our pension plans and a higher funding requirement. The funding requirement for our qualified pension plans in fiscal year 2025 is expected to be $6 million. We also expect to contribute $23 million to our non-qualified pension plans to cover expected benefit payments. We are unable to reliably estimate the amount and timing of the remaining payments beyond fiscal year 2025, therefore we have only the estimated funding for fiscal year 2025 and the total liability as of December 29, 2024 in the table above. For more information, see “Note 14: Pension and Other Retirement Plans” to the consolidated financial statements included in Part II, Item 8 of this Annual Report.
(5)In 2019, we announced that we planned to contribute up to $250 million to Align through 2028 to fund various projects as approved by Align’s board from time to time. As of December 29, 2024, we had contributed $114 million in capital toward these planned contributions. Should the board, of which we have 50% of the voting power, choose not to approve additional projects, the remaining contributions would not be required. Additionally, we have committed to contribute up to $25 million to the TPG Rise Climate investment fund through July 2027. As of December 29, 2024, we had contributed $17 million in capital toward this commitment. Lastly, we have a capital support agreement with Murphy Family Farms whereby we are committed to advance up to $50 million to cover operating costs of Murphy Family Farms if certain conditions are
73
met. No such advances have been made. We are unable to reliably estimate if or when any of these commitments will be drawn upon.
(6)Through the Fresh Pork segment, we have purchase agreements with certain independent suppliers. Some of these arrangements obligate us to purchase all of the hogs produced by these suppliers. Other arrangements obligate us to purchase a fixed amount of hogs. Due to the uncertainty of the number of hogs that we are obligated to purchase and the uncertainty of market prices at the time of hog purchases, we have estimated our obligations under these arrangements. Future payments were estimated using current live hog market prices, available futures contract prices and internal projections adjusted for historical quality premiums.
(7)Through the Hog Production segment, we use contract farmers and their facilities to raise hogs produced from our breeding stock. Under multi-year contracts, the farmers provide the initial facility investment, labor and front-line management in exchange for a performance-based service fee payable upon delivery. We are obligated to pay this service fee for all hogs delivered. We have estimated our obligation based on expected hogs delivered from these farmers.
(8)Includes fixed-price forward grain purchase contracts totaling $76 million. Also includes unpriced forward grain purchase contracts which, if valued using market prices as of December 29, 2024, would be $102 million. These forward grain contracts are accounted for as normal purchases. As a result, they are not recorded in the balance sheet.
(9)Other long-term liabilities consist of long-term casualty insurance reserves, deferred compensation, contingent liabilities, and asset retirement obligations, among others. We are unable to estimate reliably the timing of settlement of these liabilities.
Other Anticipated or Potential Cash Requirements
Capital Expenditures
The Company remains in a strong financial position due to its robust cash flows, liquidity, and solid balance sheet. We plan to continue to support the business in 2025 through capital expenditures in the range of $400 million to $500 million, inclusive of profit improvement projects, such as packaged meats capacity expansion and automation, as well as repairs and maintenance.
Dividends
Returning cash to shareholders in the form of dividends is also a top priority for the Company. On March 24, 2025, our Board declared a quarterly cash dividend of $0.25 per share of common stock, which is payable on April 22, 2025, to shareholders of record on April 10, 2025. We anticipate the remaining quarterly dividends in fiscal 2025 will be $0.25 per share, resulting in an annual dividend rate in fiscal 2025 of $1.00 per share. The declaration of dividends is subject to the discretion of our Board and depends on various factors, including our net income, financial condition, cash requirements, business prospects, and other factors that our Board deems relevant to its analysis and decision making.
Monarch Sale Notice
On January 16, 2025, TPG Rise Climate, one of the other two equal joint venture partners in Monarch, delivered a sale notice under the joint venture agreement, pursuant to which Monarch must pursue a sale of the joint venture. In the event that a sale of Monarch is not consummated before January 17, 2026, TPG Rise Climate may require that Monarch purchase TPG Rise Climate’s ownership interests in Monarch.
Altosano Redeemable Noncontrolling Interest
After December 31, 2024, our noncontrolling interest (“NCI”) holders in Altosano have the right to exercise a put option that would obligate us to redeem 40% of their interest. After December 31, 2027 the NCI holders in Altosano have the right to exercise a put option for the remainder of their interest. The redemption value for the NCI is fair value. As of December 29, 2024, the value of the NCI on our consolidated balance sheet was $225 million.
Contingent Losses
Like other participants in our industry, we are subject to various laws and regulations administered by federal, state and other government entities, including the U.S. Environmental Protection Agency and corresponding state agencies, as well as the Grain Inspection, Packers and Stockyard Administration, the USDA, the OSHA, the Commodity Futures Trading Commission and similar agencies in foreign countries. We, from time to time, receive
74
notices and inquiries from regulatory authorities and others asserting that we are not in compliance with such laws and regulations. In some instances, litigation ensues. In addition, individuals may initiate litigation against us.
The consolidated financial statements reflect accruals for contingent losses associated with various claims. These matters will not affect our profits or losses in future periods unless our accruals prove to be insufficient or excessive. It is reasonably possible that a change in our estimates may occur in the near term and that our accruals could be insufficient. We are unable to estimate the amount of possible loss in excess of our accruals, which could be material. Additionally, legal expenses incurred in our and our subsidiaries’ defense of these claims and any payments made to plaintiffs through unfavorable verdicts or otherwise could negatively impact our cash flows and our liquidity position. For more information on contingencies, refer to “Note 18: Regulation and Contingencies” to the consolidated financial statements included in Part II, Item 8 of this Annual Report.
Risk Management Activities
We are exposed to market risks primarily from changes in commodity prices, and to a lesser degree, interest rates and foreign exchange rates. To mitigate these risks, we utilize derivative instruments to hedge our exposure to changing prices and rates, as more fully described in “Item 7A. Quantitative and Qualitative Disclosures About Market Risk” and “Note 8: Derivative Financial Instruments” to the consolidated financial statements included in Part II, Item 8 of this Annual Report. See these sections for more information on the effects of derivative instruments on our consolidated statements of income.
Our liquidity position may be positively or negatively affected by changes in the value of our derivative portfolio. When the value of our open derivative contracts decreases, we may be required to post margin deposits with our brokers and counterparties to cover a portion of the decrease. Conversely, when the value of our open derivative contracts increases, our brokers may be required to deliver margin deposits to us for a portion of the increase. Over the past two fiscal years, the maximum amount of margin deposits held by our brokers and counterparties at any given time was $97 million.
The effects, positive or negative, on liquidity resulting from our risk management activities historically have tended to be mitigated by offsetting changes in cash prices in our core business. For example, in a period of rising grain prices, gains resulting from long grain derivative positions would generally be offset by higher cash prices paid to farmers and other suppliers in spot markets. These offsetting changes do not always occur, however, in the same amounts or in the same period, with lag times of as much as twelve months.
Guarantees
We and certain other joint venture partners in Monarch joint and severally guarantee Monarch’s debt, interest and fees. As of December 29, 2024, the maximum amount of loans that could be outstanding under Monarch’s debt agreements was $61 million and the loans mature in June 2025. Monarch’s outstanding debt was $43 million as of the end of fiscal year 2024.
The guarantee involves elements of performance and credit risk and is not included in the consolidated balance sheets. We could become liable in connection with Monarch’s obligation depending on the ability of Monarch to perform on its obligation. If we consider it probable that we will become responsible for the obligation, we would record the liability on our consolidated balance sheet.
Non-GAAP Measures
In arriving at our presentation of non-GAAP financial measures, we exclude items that have an impact on our income statement that, in the judgment of our management, are items that, either as a result of their nature or size, could, were they not identified, potentially cause investors to extrapolate future performance from an improper base. While not all inclusive, examples of these items include:
•loss contingencies, due to the difficulty in predicting future events, their timing and size;
•transactions or events that are not part of our core business activities or are unusual in their nature (whether gains or losses); and
75
•the tax effects of the foregoing items.
Adjusted Net Income from Continuing Operations Attributable to Smithfield and Adjusted Net Income from Continuing Operations per Common Share Attributable to Smithfield
The following table provides a reconciliation of net income from continuing operations to adjusted net income from continuing operations attributable to Smithfield. Adjusted net income from continuing operations attributable to Smithfield and adjusted net income from continuing operations per common share attributable to Smithfield are non-GAAP measures. We believe these non-GAAP measures are useful for investors because they exclude the effects of items that are unusual in nature, infrequent in occurrence or otherwise stem from strategic decisions to restructure our operations. Although we believe these non-GAAP measures provide a better comparison of our year-over-year performance and are frequently used by investors and securities analysts in their evaluations of companies, they have limitations as analytical tools. As such, adjusted net income from continuing operations attributable to Smithfield and adjusted net income from continuing operations per common share attributable to Smithfield are not intended to be alternatives to net income from continuing operations, net income from continuing operations per common share or any other performance measures derived in accordance with GAAP and should not be used by investors or other users of our financial statements in isolation for formulating decisions as they exclude a number of important cash and non-cash charges.
| Fiscal Year | |||||||||||||||||
| 2024 | 2023 |
Affected income statement
account
|
|||||||||||||||
(in millions, except per share data) |
|||||||||||||||||
Net income from continuing operations attributable to Smithfield |
783 | (138) | |||||||||||||||
Employee Retention Tax Credits (1)
|
(86) | — | Cost of sales |
||||||||||||||
Employee Retention Tax Credits (1)
|
(1) | — | SG&A |
||||||||||||||
West Coast Exit and Hog Production Reform (2)
|
(38) | — | Operating gains |
||||||||||||||
West Coast Exit and Hog Production Reform (3)
|
31 | 195 | Cost of sales |
||||||||||||||
West Coast Exit and Hog Production Reform (4)
|
— | 49 | (Income) loss from equity method investments |
||||||||||||||
| Insurance recoveries | (4) | (5) | Operating gains | ||||||||||||||
Litigation charges (5)
|
— | 208 | SG&A |
||||||||||||||
| Gain on sale of Vernon, California facility | — | (86) | Operating gains |
||||||||||||||
| Incremental costs from destruction of property | 4 | 3 | Cost of sales |
||||||||||||||
Income tax effect of non-GAAP adjustments (6)
|
24 | (94) | Income tax expense (benefit) |
||||||||||||||
| Adjusted net income from continuing operations attributable to Smithfield | $ | 714 | $ | 132 | |||||||||||||
Net income (loss) from continuing operations attributable to Smithfield per common share (basic and diluted) |
$ | 2.06 | $ | (0.36) | |||||||||||||
| Adjusted net income from continuing operations attributable to Smithfield per common share (basic and diluted) | $ | 1.88 | $ | 0.35 | |||||||||||||
________________
(1)In the second quarter of 2024, we recognized $86 million and $1 million of employee retention tax credits in cost of sales and SG&A, respectively. For more information about the employee retention tax credits, see “Note 7: Employee Retention Tax Credits” to the consolidated financial statements included in Part II, Item 8 of this Annual Report.
(2)Includes a $32 million gain on sale of our Utah hog farms and a $6 million gain on the sale of breeding stock to Murphy Family Farms.
(3)Consists of costs related to the closure of our Vernon, California processing facility, the closure and/or reduction of certain farms in Arizona, California, Missouri and Utah and certain residual operating and restructuring expenses, including the termination of a number of agreements with contract farmers, workforce reduction, and accelerated depreciation of
76
machinery equipment with no future alternative use, due to discontinuation of operations in the West Coast and efforts to improve the cost structure of our Hog Production segment.
(4)Includes an impairment of certain biogas assets recognized by our joint venture, Align, and costs incurred in connection with the closure of certain farms in Missouri that impacted assets owned by our joint venture, Monarch.
(5)Consists of accruals for the antitrust price-fixing and antitrust wage-fixing litigation matters that are described in “Note 18: Regulation and Contingencies” to the consolidated financial statements included in Part II, Item 8 of this Annual Report.
(6)Represents the tax effects of the non-GAAP adjustments based on a statutory tax rate of 25.7%.
EBITDA from Continuing Operations, Adjusted EBITDA from Continuing Operations and Adjusted EBITDA Margin from Continuing Operations
The following table provides a reconciliation of net income from continuing operations to EBITDA from continuing operations and adjusted EBITDA from continuing operations. EBITDA from continuing operations, adjusted EBITDA from continuing operations and adjusted EBITDA margin from continuing operations are non-GAAP measures. We believe EBITDA from continuing operations is a useful measure to our stakeholders because it excludes the effects of financing and investing activities by eliminating interest and depreciation costs to provide a comparable year-over-year analysis. We believe adjusted EBITDA from continuing operations is a useful measure as it excludes the effect of discontinued operations, non-operating gains and losses, and other items that are unusual in nature, infrequent in occurrence or otherwise stem from strategic decisions to restructure our operations. We believe adjusted EBITDA margin from continuing operations is a useful measure as it evaluates overall operating performance, ability to pursue and service possible debt opportunities and possible future investment opportunities. We believe these non-GAAP measures provide a more comparable year-over-year analysis. Although these non-GAAP measures are frequently used by investors and securities analysts in their evaluations of companies, they have limitations as analytical tools. As such, EBITDA from continuing operations, adjusted EBITDA from continuing operations and adjusted EBITDA margin from continuing operations are not intended to be alternatives to net income from continuing operations or any other performance measures derived in accordance with GAAP and should not be used by investors or other users of our financial statements in isolation for formulating decisions as they exclude a number of important cash and non-cash charges.
77
| Fiscal Year | |||||||||||||||||
| 2024 | 2023 |
Affected Income Statement
Account
|
|||||||||||||||
(in millions, except percentages) |
|||||||||||||||||
| Net income (loss) from continuing operations | $ | 798 | $ | (133) | |||||||||||||
| Interest expense, net | 66 | 76 | |||||||||||||||
| Income tax expense (benefit) | 271 | (41) | |||||||||||||||
Depreciation and amortization |
339 | 427 | |||||||||||||||
| EBITDA from continuing operations | $ | 1,474 | $ | 329 | |||||||||||||
| Employee Retention Tax Credits | (86) | — | Cost of sales |
||||||||||||||
| Employee Retention Tax Credits | (1) | — | SG&A |
||||||||||||||
| West Coast Exit and Hog Production Reform | (38) | — | Operating gains |
||||||||||||||
West Coast Exit and Hog Production Reform (1)
|
29 | 110 | Cost of sales |
||||||||||||||
| West Coast Exit and Hog Production Reform | — | 49 | (Income) loss from equity method investments | ||||||||||||||
| Insurance recoveries | (4) | (5) | Operating gains | ||||||||||||||
| Incremental costs from destruction of property | 4 | 3 | Cost of sales |
||||||||||||||
| Litigation charges | — | 208 | SG&A |
||||||||||||||
| Gain on sale of Vernon, California facility | — | (86) | Operating gains |
||||||||||||||
| Adjusted EBITDA from continuing operations | $ | 1,379 | $ | 610 | |||||||||||||
Net income (loss) margin from continuing operations |
5.6 | % | (0.9) | % | |||||||||||||
| Adjusted EBITDA margin from continuing operations | 9.7 | % | 4.2 | % | |||||||||||||
(1)Excludes accelerated depreciation and amortization charges of $2 million and $85 million for fiscal years 2024 and 2023, respectively, as such charges are included in the depreciation and amortization line in this table.
Net Debt and Ratio of Net Debt to Adjusted EBITDA from Continuing Operations
The following table provides a reconciliation of total debt and finance lease obligations to net debt, the ratio of total debt and finance lease obligations to net income from continuing operations, and the ratio of net debt to adjusted EBITDA from continuing operations. Net debt and the ratio of net debt to adjusted EBITDA from continuing operations are non-GAAP measures. We believe net debt is a useful measure as it helps to give investors a clear understanding of our financial position. Net debt is also used to calculate certain leverage ratios. We believe the ratio of net debt to adjusted EBITDA from continuing operations is a useful measure as it monitors the sustainability of our debt levels and our ability to take on additional debt against adjusted EBITDA from continuing operations, which is used as an operating performance measure. We believe these non-GAAP measures provide a more comparable year-over-year analysis. Although net debt and the ratio of net debt to adjusted EBITDA from continuing operations are frequently used by investors and securities analysts in their evaluations of companies, these non-GAAP measures have limitations as analytical tools. As such, net debt and the ratio of net debt to adjusted EBITDA from continuing operations are not intended to be alternatives to total debt and finance lease obligations and the ratio of total debt and finance lease obligations to net income from continuing operations or any other performance measures derived in accordance with GAAP and should not be used by investors or other users of our financial statements in isolation for formulating decisions as they exclude a number of important cash and non-cash charges.
78
Fiscal Year Ended |
|||||||||||
| December 29, 2024 |
December 31, 2023 |
||||||||||
(in millions, except ratios) |
|||||||||||
| Current portion of long-term debt and capital lease | $ | 3 | $ | 27 | |||||||
Long-term debt and finance lease obligations |
1,999 | 2,006 | |||||||||
| Total debt and finance lease obligations | 2,002 | 2,033 | |||||||||
Cash and cash equivalents |
(943) | (687) | |||||||||
| Net debt | $ | 1,059 | $ | 1,345 | |||||||
Net income (loss) from continuing operations |
$ | 798 | $ | (133) | |||||||
| Adjusted EBITDA from continuing operations | $1,379 | $610 | |||||||||
Ratio of total debt and finance lease obligations to net income (loss) from continuing operations |
2.5x | (15.3x) | |||||||||
Ratio of net debt to adjusted EBITDA from continuing operations |
0.8x | 2.2x | |||||||||
Adjusted Operating Profit and Adjusted Operating Profit Margin
The following table provides a reconciliation of operating profit to adjusted operating profit. Adjusted operating profit and adjusted operating profit margin are non-GAAP measures. We believe these non-GAAP measures are useful to investors because they provide a better understanding of underlying operating results and trends of established, ongoing operations of our segments, excluding the impact of items that are unusual in nature, infrequent in occurrence or otherwise stem from strategic decisions to restructure our operations. These non-GAAP measures are not intended to be alternatives to operating profit, operating profit margin or any other performance measures derived in accordance with GAAP and should not be used by investors or other users of our financial statements in isolation for formulating decisions as they exclude a number of important cash and non-cash charges.
79
| Fiscal Year 2024 | Packaged Meats | Fresh Pork | Hog Production |
Other (1)
|
Corporate (2)
|
Unallocated (3)
|
Consolidated | ||||||||||||||||||||||||||||||||||
(in millions, except percentages) |
|||||||||||||||||||||||||||||||||||||||||
Operating profit (loss) |
$ | 1,168 | $ | 266 | $ | (144) | $ | 35 | $ | (153) | $ | (55) | $ | 1,118 | |||||||||||||||||||||||||||
| Employee retention tax credits | (38) | (41) | (8) | — | — | — | (87) | ||||||||||||||||||||||||||||||||||
| West Coast Exit and Hog Production Reform | — | — | — | — | — | (7) | (7) | ||||||||||||||||||||||||||||||||||
| Insurance recoveries | — | — | — | — | — | (4) | (4) | ||||||||||||||||||||||||||||||||||
| Incremental costs from destruction of property | — | — | — | — | — | 4 | 4 | ||||||||||||||||||||||||||||||||||
| Adjusted operating profit (loss) | $ | 1,130 | $ | 225 | $ | (152) | $ | 35 | $ | (153) | $ | (61) | $ | 1,024 | |||||||||||||||||||||||||||
Operating profit (loss) margin |
14.0 | % | 3.4 | % | (4.8) | % | 7.4 | % | NM | NM | 7.9 | % | |||||||||||||||||||||||||||||
Adjusted operating profit (loss) margin |
13.6 | % | 2.9 | % | (5.0) | % | 7.4 | % | NM | NM | 7.2 | % | |||||||||||||||||||||||||||||
Fiscal Year 2023 |
Packaged Meats | Fresh Pork | Hog Production |
Other (1)
|
Corporate (2)
|
Unallocated (3)
|
Consolidated | ||||||||||||||||||||||||||||||||||
(in millions, except percentages) |
|||||||||||||||||||||||||||||||||||||||||
Operating profit (loss) |
$ | 1,066 | $ | 117 | $ | (756) | $ | (4) | $ | (107) | $ | (371) | $ | (56) | |||||||||||||||||||||||||||
| Litigation charges | — | — | — | — | — | 208 | 208 | ||||||||||||||||||||||||||||||||||
| West Coast Exit and Hog Production Reform | — | — | — | — | — | 195 | 195 | ||||||||||||||||||||||||||||||||||
| Gain on sale of Vernon, California facility | — | — | — | — | — | (86) | (86) | ||||||||||||||||||||||||||||||||||
| Insurance recoveries | — | — | — | — | — | (5) | (5) | ||||||||||||||||||||||||||||||||||
| Incremental costs from destruction of property | — | — | — | — | — | 3 | 3 | ||||||||||||||||||||||||||||||||||
| Adjusted operating profit (loss) | $ | 1,066 | $ | 117 | $ | (756) | $ | (4) | $ | (107) | $ | (56) | $ | 258 | |||||||||||||||||||||||||||
| Operating profit (loss) margin | 12.9 | % | 1.5 | % | (22.8) | % | (0.8) | % | NM | NM | (0.4) | % | |||||||||||||||||||||||||||||
| Adjusted operating profit (loss) margin | 12.9 | % | 1.5 | % | (22.8) | % | (0.8) | % | NM | NM | 1.8 | % | |||||||||||||||||||||||||||||
________________
(1)Includes our Mexico and Bioscience operations.
(2)Represents general corporate expenses for management and administration of the business.
(3)Includes certain costs of sales, SG&A and operating gains that we do not allocate to our segments.
Critical Accounting Estimates
The preparation of consolidated financial statements requires us to make estimates and assumptions. These estimates and assumptions are based on our judgment, experience and our understanding of the current facts and circumstances. Actual results could differ from those estimates. Certain of our accounting estimates are considered critical as they are both important to the representation of our financial condition and results of operations and require significant or complex judgment on the part of management. The following is a summary of certain accounting policies and estimates that we consider to be critical. Our accounting policies are more fully discussed in “Note 1: Summary of Significant Accounting Policies” to the consolidated financial statements included in Part II, Item 8 of this Annual Report.
80
Revenue Recognition
Our revenue (sales) is primarily derived from contracts with customers for the purchase of our products. Revenue is recognized at a point in time when our performance obligation has been satisfied and control of the promised goods is transferred to the customer, which generally occurs upon shipment or delivery to a customer based on the terms of the sale. The primary performance obligation in our contracts with customers is to provide meat products. Shipping and handling activities are considered part of the fulfillment of our promise to provide meat products and not a separate performance obligation. Shipping and handling costs are reported as a component of cost of sales.
Revenue is recorded at the amount of consideration we expect to receive in exchange for providing goods to customers. The transaction price may include estimates of variable consideration, including a variety of customer sales incentive programs, such as rebates, product returns and coupons redeemed by consumers. Our estimates of variable consideration are based on a number of factors including history with the respective customer, current performance and future projections. We sufficiently constrain estimates of variable consideration based on the likelihood and magnitude of a potential revenue reversal when the uncertainties associated with the variable consideration are subsequently resolved.
We review and update estimates of variable consideration regularly. We have not experienced any material reversals of revenue recognized in the past three fiscal years resulting from overestimation of variable consideration nor do we expect there will be a material change in our estimates of variable consideration that would result in a material reversal of revenue recognized in the consolidated statements of income. The effect of any reversal of revenue would be recognized in the period in which an adjustment to our estimate is identified.
Contingent Liabilities
We are subject to lawsuits, investigations and other claims related to the operation of our farms and facilities, labor, livestock procurement, securities, the environment, our products, taxes and other matters, and are required to assess the likelihood of any adverse judgments or outcomes to these matters, as well as potential ranges of loss. A determination of the amount of accruals and disclosures required, if any, are made after considerable analysis of each individual issue or claim.
We accrue for contingent liabilities, including future defense costs, when an assessment of the risk of loss is probable and can be reasonably estimated. We disclose contingent liabilities when the risk of loss is reasonably possible or probable.
Our contingent liabilities contain uncertainties because the eventual outcome will result from future events. Our determination of accruals requires estimates and judgments related to the possible outcomes, differing interpretations of the law, assessments of the amounts of potential damages, settlements or defense costs, and the effectiveness of strategies or other factors beyond our control.
The consolidated financial statements reflect accruals for estimated contingent losses associated with various claims. These matters will not affect our profits or losses in future periods unless our accruals prove to be insufficient or excessive. However, legal expenses incurred in our defense of legal matters and any payments made to plaintiffs through unfavorable verdicts or otherwise will negatively impact our cash flows and our liquidity position.
If actual results are not consistent with the estimates or assumptions used to develop our accruals for contingent losses, we may be exposed to gains or losses that could have a material effect on our future results of operations and cash flows.
Impairment of Goodwill and Indefinite-Lived Intangible Assets
Goodwill and non-amortizable intangible assets are tested for impairment annually in the fourth quarter, or sooner if impairment indicators arise. In the evaluation of goodwill for impairment, we may perform a qualitative assessment to determine if it is more likely than not that the fair value of a reporting unit is less than its carrying amount. If it is not, no further analysis is required. If it is, a quantitative goodwill impairment test is performed to measure the amount of goodwill impairment loss to be recognized for that reporting unit, if any.
81
To identify if an impairment exists, we compare the fair value of a reporting unit with its carrying amount, including goodwill. The fair value of a reporting unit is estimated by applying valuation multiples of earnings and/or estimating future discounted cash flows. If the fair value of a reporting unit exceeds its carrying amount, goodwill is not impaired. However, if the carrying amount of a reporting unit exceeds its fair value, an impairment loss is recognized in an amount equal to that excess.
For our other non-amortizable intangible assets, if the carrying value of the intangible asset exceeds its fair value, an impairment loss is recognized in an amount equal to that excess.
The selection of earnings multiples is dependent upon assumptions regarding future levels of operating performance as well as business trends and prospects, and industry, market and economic conditions. A discounted cash flow analysis requires us to make various judgmental assumptions about sales, operating margins, growth rates and discount rates. When estimating future discounted cash flows, we consider the assumptions that hypothetical marketplace participants would use in estimating future cash flows. In addition, where applicable, an appropriate discount rate is used, based on an industry-wide average cost of capital or location-specific economic factors. We consider all these factors to be level 3 inputs, as defined in “Note 16: Fair Value Measurements” to the consolidated financial statements included in Part II, Item 8 of this Annual Report.
The fair values of our trademarks have been estimated using a royalty rate method. Assumptions about royalty rates are based on the rates at which similar brands and trademarks are licensed in the marketplace.
Our impairment analysis contains uncertainties due to uncontrollable events that could positively or negatively impact the anticipated future economic and operating conditions.
As of December 29, 2024, we had $1,613 million of goodwill and $1,216 million of non-amortizable trademarks. Our goodwill is included in the following reporting units:
•Packaged Meats: $1,503 million;
•Mexico: $69 million;
•Fresh Pork: $34 million;
•Hog Production:$4 million; and
•Bioscience: $4 million.
We have not recognized an impairment of goodwill or other intangible assets in the past three fiscal years. A hypothetical 10% decrease in the estimated fair value of any of our reporting units would not result in an impairment. A hypothetical 10% decrease in the estimated fair value of our intangible assets also would not result in an impairment.
Income Taxes
We estimate total income tax expense based on statutory tax rates and tax planning opportunities available to us in various jurisdictions in which we earn income.
Federal income taxes include an estimate for taxes on earnings of foreign subsidiaries expected to be remitted to the U.S. and be taxable, but not for earnings considered indefinitely invested in the foreign subsidiary. We account for the global intangible low-taxed income inclusion from foreign subsidiaries in the period in which it is incurred.
Deferred tax assets and liabilities are recognized for the estimated future tax consequences attributable to differences between the financial statement carrying amounts of assets and liabilities and their respective tax bases. Deferred tax assets and liabilities are measured using enacted tax rates in effect for the year in which those temporary differences are expected to be recovered or settled. The effect on deferred tax assets and liabilities of a change in tax rate is recognized in earnings in the period that includes the enactment date.
82
We record liabilities for uncertain tax positions based on our analysis of whether, and the extent to which, additional taxes will be due. We record these liabilities using a two-step process in which (1) we evaluate whether we believe it is more likely than not that the tax positions will be sustained on the basis of the technical merits of the position and (2) for those tax positions that meet the more-likely-than-not recognition threshold, we recognize the largest amount of tax benefit that is more than 50 percent likely to be realized upon ultimate settlement with the tax authority.
The determination of our provision for income taxes requires significant judgment, the use of estimates, and the interpretation and application of complex tax laws. Significant judgment is required in assessing the timing and amounts of deductible and taxable items. Changes in current tax laws and rates could affect recorded tax assets and liabilities in the future. In addition, changes in projected future earnings could affect the recorded valuation allowances in the future.
Our analysis of uncertain tax positions requires considerable judgment about the likelihood and amount of benefit that would be sustained upon examination by tax authorities.
Due to the complexity and inherent uncertainties surrounding income tax positions, the ultimate resolution may result in a payment that is materially different from the current estimate of the tax liabilities. To the extent we prevail in matters for which liabilities have been established, or are required to pay amounts in excess of our recorded liabilities, our effective tax rate in a given financial statement period could be materially affected. An unfavorable tax settlement would require use of cash and result in an increase in our effective tax rate in the period of resolution. A favorable tax settlement would be recognized as a reduction in our effective tax rate in the period of resolution.
Over the past three fiscal years, we have recognized $76 million of income tax expense in years subsequent to the initial recognition and measurement of an uncertain tax position and we paid $17 million to tax authorities in fiscal year 2024 upon the ultimate resolution of uncertain tax positions taken in prior years.
See “Note 13: Income Taxes” to the consolidated financial statements included in Part II, Item 8 of this Annual Report.
Pension Accounting
We historically provided the majority of our U.S. employees with pension benefits. In the second quarter of 2021, we amended our qualified pension plans to freeze the benefit accrual for all non-union participants as of June 30, 2021.
We recognize the funded status of our pension plans in our consolidated balance sheets and recognize, as a component of other comprehensive income (loss), the gains or losses and prior service costs or credits that arise during the period but are not recognized in net periodic benefit cost.
We use an independent third-party actuary to assist in the determination of our pension obligation and related costs. The measurement of our pension obligations and related costs is dependent on the use of assumptions and estimates. These assumptions include discount rates, expected returns on plan assets, salary growth rates and mortality rates. Changes in assumptions and future investment returns could potentially have a material impact on our expenses and related funding requirements.
The following weighted average assumptions were used to determine our benefit obligation and net benefit cost for fiscal year 2024:
•5.57% – Discount rate to determine net benefit cost;
•5.78% – Discount rate to determine pension benefit obligation; and
•7.05% – Expected return on plan assets.
If actual results are not consistent with our estimates or assumptions, we may be exposed to gains or losses that could be material. The effects of actual results differing from these assumptions are accumulated and amortized over future periods and, therefore, generally affect our recognized expense in such future periods.
83
An additional 0.50% decrease in the discount rate used to measure our projected benefit obligation would have further reduced the funded status by $103 million as of December 29, 2024, and would have resulted in an additional $3 million in net pension cost in fiscal year 2024.
A 0.50% decrease in expected return on plan assets would have resulted in an additional $7 million in net pension cost in fiscal year 2024.
In addition to higher net pension cost, a significant decrease in the funded status of our pension plans caused by either a devaluation of plan assets or a decline in the discount rate would result in higher pension funding requirements.
See “Note 14: Pension and Other Retirement Plans” to the consolidated financial statements included in Part II, Item 8 of this Annual Report for further information about our accounting for pension and retirement plans.
Derivative Accounting
We are exposed to market risks primarily from changes in commodity prices. To mitigate these risks, we utilize derivative instruments to hedge our exposure to changing prices. Our objective is to reduce the volatility of earnings and cash flows associated with fluctuations in commodity prices.
We record all derivatives as either assets or liabilities at fair value on the balance sheet, with the exception of contracts that qualify for the normal purchase and normal sale scope exception, which are expected to result in physical delivery. Accounting for changes in the fair value of a derivative depends on whether it qualifies and has been designated as part of a hedging relationship. For derivatives that qualify and have been designated as hedging instruments for accounting purposes, changes in fair value have no net impact on earnings, to the extent the derivative is considered perfectly effective in achieving offsetting changes in fair value attributable to the risk being hedged, until the hedged item is recognized in earnings (commonly referred to as the “hedge accounting” method). For derivatives that do not qualify or are not designated as hedging instruments for accounting purposes, changes in fair value are recorded in current period earnings (commonly referred to as the “mark-to-market” method).
We apply hedge accounting when the change in the market value of derivative contracts has historically been, and is expected to continue to be, highly effective at offsetting changes in price movements of the hedged item. If it is determined that the derivative instruments are no longer effective at offsetting changes in the price of the hedged items, then the mark-to-market method must be applied to account for the derivative instruments prospectively, which could increase volatility in our results of operations. We recognized $(25) million, $18 million and $(10) million in gains (losses) on derivatives accounted for under the mark-to-market method in fiscal years 2024, 2023 and 2022, respectively.
For additional information on derivatives, refer to “Note 1: Summary of Significant Accounting Policies” and “Note 8: Derivative Financial Instruments” to the consolidated financial statements included in Part II, Item 8 of this Annual Report, which includes detailed discussions of our accounting for and use of derivative instruments.
Recently Issued Accounting Pronouncements
For a description of recently issued accounting pronouncements, refer to “Note 1: Summary of Significant Accounting Policies” to the consolidated financial statements included in Part II, Item 8 of this Annual Report.
84
ITEM 7A. QUANTITATIVE AND QUALITATIVE DISCLOSURES ABOUT MARKET RISK
We are exposed to market risks from changes in commodity prices, interest rates and foreign exchange rates, as well as risks from concentrations of credit. To mitigate these risks, we utilize derivative instruments to hedge our exposure to changing prices and rates.
When available, we use quoted market prices or rates to determine the fair value of our derivative instruments. This may include prices or rates quoted on an exchange, such as the CME, quotes obtained from brokers, or independent valuations from external sources, such as banks. In some cases where market prices are not available, we make use of observable market-based inputs to calculate fair value.
The size and mix of our derivative portfolio vary from time to time based on our analysis of current and future market conditions. The following table presents the fair values of our open derivative financial instruments in the consolidated balance sheets:
| December 29, 2024 |
December 31, 2023 |
||||||||||
Livestock (1)
|
(30) | 27 | |||||||||
| Grains | 6 | 1 | |||||||||
Energy (1)
|
(5) | (21) | |||||||||
________________
(1)Negative amount represents net liabilities.
See “Note 8: Derivative Financial Instruments” to the consolidated financial statements included in Part II, Item 8 of this Annual Report for the effects of derivative instruments on our consolidated statements of income.
Commodities Risk
Our meat processing and hog production operations use various raw materials, primarily live hogs, corn, soybean meal and wheat, which are actively traded on commodity exchanges. These commodities are subject to significant price fluctuations. We enter into hedging transactions for these commodities when we determine conditions are appropriate to mitigate the inherent price risks. While this hedging may limit our ability to participate in gains from favorable commodity fluctuations, it also reduces the risk of loss from adverse changes in raw material prices.
We attempt to closely match the hedging instrument terms with the hedged item’s terms. Gains and losses resulting from our commodity derivative contracts are recorded in cost of sales except for lean hog contracts that are designated in cash flow hedging relationships, which are recorded in sales, and are generally offset by increases and decreases in cash prices for the underlying commodity (with such increases and decreases reflected in the same income statement line items). For example, in a period of rising grain prices, gains resulting from long grain derivative positions would generally be offset by higher cash prices paid to farmers and other suppliers in spot markets. However, under the “mark-to-market” method described above, these offsetting changes do not always occur in the same period, which could result in volatility in our results of operations.
The following table presents the sensitivity of the fair value of our open commodity derivative contracts to a hypothetical 10% change in market prices, as of December 29, 2024 and December 31, 2023:
| December 29, 2024 |
December 31, 2023 |
||||||||||
| Livestock | 64 | 28 | |||||||||
| Grains | 11 | 3 | |||||||||
| Energy | 4 | 5 | |||||||||
85
Interest Rate Risk
The following table presents the fair values and carrying values of our fixed-rate debt as of December 29, 2024 and December 31, 2023:
| December 29, 2024 | December 31, 2023 | ||||||||||||||||||||||
| Fair Value | Carrying Value | Fair Value | Carrying Value | ||||||||||||||||||||
| Debt | $ | 1,821 | $ | 1,983 | $ | 1,758 | $ | 1,979 | |||||||||||||||
We determine the fair value of fixed-rate debt using Level 2 inputs based on quoted market prices. The carrying amount of all other debt approximates fair value as those instruments are based on variable interest rates.
Changes in interest rates impact the fair value of our fixed-rate debt. A hypothetical 10% change in interest rates would impact the fair value of our fixed-rate debt by $43 million and $53 million as of December 29, 2024 and December 31, 2023, respectively.
We periodically enter into interest rate swaps to hedge our exposure to changes in interest rates on certain financial instruments and to manage the overall mix of fixed rate and floating rate debt instruments. The fair values of interest rate swaps as of December 29, 2024, and December 31, 2023 were not material.
Foreign Currency Exchange Risk
Our revenues are primarily generated from transactions denominated in U.S. dollars. However, we also generate revenues from transactions denominated in Japanese yen, Canadian dollars and Australian dollars, among others. We employ foreign currency exchange forward contracts to manage the exposure to foreign currency exchange risk. The fair values of foreign currency exchange forward contracts as of December 29, 2024 and December 31, 2023 was not material.
Concentration of Credit Risk
Our financial instruments are exposed to concentrations of credit risk primarily through our cash and cash equivalents, accounts receivable and derivatives. From time to time, we may have bank deposits in excess of insurance limits of the Federal Deposit Insurance Corporation. We have not experienced any losses in such accounts and believes it is not exposed to any significant credit risk related to its cash and cash equivalents.
Concentrations of credit risk with respect to accounts receivable are limited due to our large number of customers. As of December 29, 2024 and December 31, 2023, 12.8% and 12.5%, respectively, of our accounts receivable balance was due from Walmart. No other single customer or customer group represented 10% or greater of our accounts receivable.
With regards to derivatives used to hedge commodities, foreign exchange and interest rates, we bear risk of nonperformance by counterparties. Our trading relationships are governed by international swaps and derivatives agreements and we mitigate risk by diversifying counterparties and monitoring credit ratings.
An estimate of expected credit losses is recognized as a valuation allowance and adjusted each reporting period. The estimate is based on the current expected credit loss model and is determined based on the age of receivable balances, the financial health of the customer, historical experience, current economic conditions and expectations about future performance. The valuation allowance as of December 29, 2024 and December 31, 2023 was not material.
86
ITEM 8. FINANCIAL STATEMENTS AND SUPPLEMENTARY DATA
Report of Independent Registered Public Accounting Firm
To the Shareholders and the Board of Directors of Smithfield Foods, Inc.
Opinion on the Financial Statements
We have audited the accompanying consolidated balance sheets of Smithfield Foods, Inc. and subsidiaries (the Company) as of December 29, 2024 and December 31, 2023, the related consolidated statements of income, comprehensive income, shareholder’s equity and cash flows for each of the three years in the period ended December 29, 2024, and the related notes and financial statement schedule listed in the Index at Item 15(2) (collectively referred to as the “consolidated financial statements”). In our opinion, the consolidated financial statements present fairly, in all material respects, the financial position of the Company at December 29, 2024 and December 31, 2023, and the results of its operations and its cash flows for each of the three years in the period ended December 29, 2024, in conformity with U.S. generally accepted accounting principles.
Basis for Opinion
These financial statements are the responsibility of the Company's management. Our responsibility is to express an opinion on the Company’s financial statements based on our audits. We are a public accounting firm registered with the Public Company Accounting Oversight Board (United States) (PCAOB) and are required to be independent with respect to the Company in accordance with the U.S. federal securities laws and the applicable rules and regulations of the Securities and Exchange Commission and the PCAOB.
We conducted our audits in accordance with the standards of the PCAOB. Those standards require that we plan and perform the audit to obtain reasonable assurance about whether the financial statements are free of material misstatement, whether due to error or fraud. The Company is not required to have, nor were we engaged to perform, an audit of its internal control over financial reporting. As part of our audits we are required to obtain an understanding of internal control over financial reporting but not for the purpose of expressing an opinion on the effectiveness of the Company's internal control over financial reporting. Accordingly, we express no such opinion.
Our audits included performing procedures to assess the risks of material misstatement of the financial statements, whether due to error or fraud, and performing procedures that respond to those risks. Such procedures included examining, on a test basis, evidence regarding the amounts and disclosures in the financial statements. Our audits also included evaluating the accounting principles used and significant estimates made by management, as well as evaluating the overall presentation of the financial statements. We believe that our audits provide a reasonable basis for our opinion.
Critical Audit Matters
The critical audit matters communicated below are matters arising from the current period audit of the financial statements that were communicated or required to be communicated to the audit committee and that: (1) relate to accounts or disclosures that are material to the financial statements and (2) involved our especially challenging, subjective or complex judgments. The communication of critical audit matters does not alter in any way our opinion on the consolidated financial statements, taken as a whole, and we are not, by communicating the critical audit matters below, providing separate opinions on the critical audit matters or on the accounts or disclosures to which they relate.
87
Pension Accounting |
||||||||
| Description of the Matter |
At December 31, 2024, the Company’s defined benefit pension obligation was $1.80 billion, offset by the fair value of plan assets totaling $1.50 billion. As discussed in Notes 1 and 14 of the consolidated financial statements, the Company, with the assistance of a third-party actuary, measures the defined benefit pension obligation at December 31, or upon a remeasurement event, using actuarial assumptions including discount rates. Auditing the defined benefit pension obligation was complex due to the significant estimation uncertainty in evaluating the discount rate used in the Company’s measurement process. |
|||||||
| How We Addressed the Matter in Our Audit | To test the Company's accounting for the defined benefit pension obligation, we performed audit procedures that included, among others, evaluating the discount rate assumption with the assistance of our actuarial specialists. For example, we compared the discount rate used by management to historical trends, independently calculated an expected range for the discount rate based on the maturity and duration of the projected benefit payments, and compared the projected benefit payments to the historical benefits paid. | |||||||
Contingent Liabilities |
||||||||
| Description of the Matter |
As described in Note 18 of the consolidated financial statements, the Company is involved in antitrust price-fixing litigation with a number of individual parties. The Company recognizes a contingent liability, including future defense costs, when an assessment of the risk of loss is probable and can be reasonably estimated. For the antitrust price-fixing litigation, where a settlement agreement has not yet been reached with the claimant, judgment is required to determine the probability and estimate of the loss.
Auditing management’s measurement and disclosure of the amount of contingent liabilities for antitrust price-fixing litigation was subjective and required more complex auditor judgment. For instance, auditing management's judgments related to the outcome of litigation with claimants where the matter has not yet been tried in court or where the Company has not otherwise agreed to a settlement with claimants was more complex due to the judgment applied in evaluating the likelihood of the outcomes.
|
|||||||
| How We Addressed the Matter in Our Audit | To test the Company's accounting for and disclosure of ongoing antitrust price-fixing litigation, our audit procedures included, among others, reviewing the initial complaint, testing the Company's evaluation of the probability of outcome through inspection of responses to inquiry letters to both internal and external counsel, evaluating relevant events up to the audit report date, and by obtaining written representations from executives of the Company. When applicable, we also compared the Company's evaluation of these matters with its relevant history for similar legal contingencies that have been settled or otherwise resolved by obtaining and evaluating settlement agreements. In addition, we evaluated the adequacy of the Company’s financial statement disclosures. | |||||||
/s/ Ernst & Young LLP
We have served as the Company’s auditor since 2017.
March 25, 2025
88
SMITHFIELD FOODS, INC. AND SUBSIDIARIES
CONSOLIDATED STATEMENTS OF INCOME
(in millions, except for share and per share data)
| Twelve Months Ended | |||||||||||||||||
| December 29, 2024 |
December 31, 2023 |
January 1, 2023 |
|||||||||||||||
| Sales | $ | $ | $ | ||||||||||||||
| Cost of sales | |||||||||||||||||
| Gross profit | |||||||||||||||||
| Selling, general and administrative expenses | |||||||||||||||||
Operating gains |
( |
( |
( |
||||||||||||||
Operating profit (loss) |
( |
||||||||||||||||
Interest expense, net |
|||||||||||||||||
| Non-operating gains | ( |
( |
( |
||||||||||||||
| Income (loss) from continuing operations before income taxes | ( |
||||||||||||||||
| Income tax expense (benefit) | ( |
||||||||||||||||
| (Income) loss from equity method investments | ( |
||||||||||||||||
| Net income (loss) from continuing operations | ( |
||||||||||||||||
Net income from continuing operations attributable to noncontrolling interests |
|||||||||||||||||
Net income (loss) from continuing operations attributable to Smithfield |
( |
||||||||||||||||
| Income from discontinued operations before income taxes | |||||||||||||||||
Income tax expense from discontinued operations |
|||||||||||||||||
Net income from discontinued operations |
|||||||||||||||||
Net income from discontinued operations attributable to noncontrolling interests |
|||||||||||||||||
Net income from discontinued operations attributable to Smithfield |
|||||||||||||||||
| Net income | |||||||||||||||||
Net income attributable to noncontrolling interests |
|||||||||||||||||
| Net income attributable to Smithfield | $ | $ | $ | ||||||||||||||
| Net income (loss) per common share attributable to Smithfield: | |||||||||||||||||
Basic and diluted: |
|||||||||||||||||
| Continuing operations | $ | $ | ( |
$ | |||||||||||||
| Discontinued operations | |||||||||||||||||
| Total | $ | $ | $ | ||||||||||||||
| Weighted average shares outstanding | |||||||||||||||||
| Basic | |||||||||||||||||
| Diluted | |||||||||||||||||
See Notes to Consolidated Financial Statements
89
SMITHFIELD FOODS, INC. AND SUBSIDIARIES
CONSOLIDATED STATEMENTS OF COMPREHENSIVE INCOME
(in millions)
| Twelve Months Ended | |||||||||||||||||
| December 29, 2024 |
December 31, 2023 |
January 1, 2023 |
|||||||||||||||
| Net income | $ | $ | $ | ||||||||||||||
Other comprehensive income (loss), net of tax: |
|||||||||||||||||
| Foreign currency translation | ( |
( |
|||||||||||||||
| Pension accounting | ( |
||||||||||||||||
| Hedge accounting | ( |
( |
( |
||||||||||||||
Total other comprehensive income (loss) |
( |
( |
|||||||||||||||
| Comprehensive income | |||||||||||||||||
| Comprehensive income (loss) attributable to noncontrolling interest | ( |
||||||||||||||||
| Comprehensive income attributable to Smithfield | $ | $ | $ | ||||||||||||||
See Notes to Consolidated Financial Statements
90
SMITHFIELD FOODS, INC. AND SUBSIDIARIES
CONSOLIDATED BALANCE SHEETS
(in millions, except share data)
| December 29, 2024 |
December 31, 2023 |
||||||||||
| ASSETS | |||||||||||
| Current assets: | |||||||||||
| Cash and cash equivalents | $ | $ | |||||||||
| Accounts receivable, net | |||||||||||
| Inventories, net | |||||||||||
| Current assets of discontinued operations | |||||||||||
| Prepaid expenses and other current assets | |||||||||||
| Total current assets | |||||||||||
| Property, plant and equipment, net | |||||||||||
| Goodwill | |||||||||||
| Intangible assets, net | |||||||||||
| Operating lease assets | |||||||||||
| Equity method investments | |||||||||||
| Long-term assets of discontinued operations | |||||||||||
| Other assets | |||||||||||
| Total assets | $ | $ | |||||||||
| LIABILITIES AND EQUITY | |||||||||||
| Current liabilities: | |||||||||||
| Accounts payable | |||||||||||
| Current portion of long-term debt and finance lease obligations | |||||||||||
| Current portion of operating lease obligations | |||||||||||
| Current liabilities of discontinued operations | |||||||||||
| Accrued expenses and other current liabilities | |||||||||||
| Total current liabilities | |||||||||||
| Long-term debt and finance lease obligations | |||||||||||
| Long-term operating lease obligations | |||||||||||
| Deferred income taxes, net | |||||||||||
| Net long-term pension obligation | |||||||||||
| Long-term liabilities of discontinued operations | |||||||||||
| Other liabilities | |||||||||||
| Redeemable noncontrolling interests | |||||||||||
Commitments and contingencies (Note 18) |
|||||||||||
| Equity: | |||||||||||
| Shareholder’s equity: | |||||||||||
Preferred stock, |
|||||||||||
Common stock, |
|||||||||||
| Additional paid-in capital | |||||||||||
| Retained earnings | |||||||||||
| Accumulated other comprehensive loss | ( |
( |
|||||||||
| Total shareholder’s equity | |||||||||||
| Noncontrolling interests | |||||||||||
| Total equity | |||||||||||
| Total liabilities and equity | $ | $ | |||||||||
See Notes to Consolidated Financial Statements
91
SMITHFIELD FOODS, INC. AND SUBSIDIARIES
CONSOLIDATED STATEMENTS OF CASH FLOWS
(in millions)
| Twelve Months Ended | |||||||||||||||||
| December 29, 2024 |
December 31, 2023 |
January 1, 2023 |
|||||||||||||||
| Cash flows from operating activities: | |||||||||||||||||
| Net income | $ | $ | $ | ||||||||||||||
| Less: Net income from discontinued operations | ( |
( |
( |
||||||||||||||
| Net income (loss) from continuing operations | $ | $ | ( |
$ | |||||||||||||
| Adjustments to reconcile net income from continuing operations to net cash flows from operating activities of continuing operations: | |||||||||||||||||
| Depreciation and amortization | |||||||||||||||||
| Deferred income taxes | ( |
||||||||||||||||
| Impairment of assets | |||||||||||||||||
| Gain on sale/dilution of equity method investments | ( |
||||||||||||||||
| (Income) loss from equity method investments | ( |
||||||||||||||||
(Gain) loss on sale of businesses and other assets |
( |
||||||||||||||||
(Gain) loss on sale of property, plant and equipment |
( |
( |
|||||||||||||||
| Change in accounts receivable | ( |
( |
|||||||||||||||
| Change in inventories | ( |
||||||||||||||||
| Change in prepaid expenses and other current assets | ( |
( |
|||||||||||||||
| Change in accounts payable | ( |
( |
|||||||||||||||
| Change in accrued expenses and other current liabilities | ( |
( |
|||||||||||||||
| Other | ( |
( |
|||||||||||||||
| Net cash flows from operating activities of continuing operations | |||||||||||||||||
| Cash flows from investing activities: | |||||||||||||||||
| Capital expenditures | ( |
( |
( |
||||||||||||||
| Net expenditures from breeding stock transactions | ( |
( |
( |
||||||||||||||
| Investments in partnerships and other assets | ( |
( |
( |
||||||||||||||
| Proceeds from the sale of investments | |||||||||||||||||
| Business dispositions | |||||||||||||||||
| Proceeds from sale of property, plant and equipment and other assets | |||||||||||||||||
| Other | |||||||||||||||||
Net cash flows from (used in) investing activities of continuing operations |
( |
( |
|||||||||||||||
| Cash flows from financing activities: | |||||||||||||||||
| Payment of dividends | ( |
( |
( |
||||||||||||||
| Repayments to Securitization Facility | ( |
( |
( |
||||||||||||||
| Proceeds from Securitization Facility | |||||||||||||||||
| Purchase of redeemable noncontrolling interest | ( |
||||||||||||||||
| Net repayments to revolving credit facilities | ( |
( |
( |
||||||||||||||
92
| Twelve Months Ended | |||||||||||||||||
| December 29, 2024 |
December 31, 2023 |
January 1, 2023 |
|||||||||||||||
| Principal payments on long-term debt and finance lease obligations | ( |
( |
( |
||||||||||||||
Payment of deferred purchase consideration for acquisition |
( |
( |
( |
||||||||||||||
| Other | ( |
||||||||||||||||
Net cash flows used in financing activities of continuing operations |
( |
( |
( |
||||||||||||||
| Effect of foreign exchange rate changes on cash from continuing operations | ( |
||||||||||||||||
| Cash flows from discontinued operations | |||||||||||||||||
Net cash flows from (used in) operating activities of discontinued operations |
( |
||||||||||||||||
Net cash flows from (used in) investing activities of discontinued operations |
( |
( |
( |
||||||||||||||
Net cash flows from (used in) financing activities of discontinued operations |
( |
( |
|||||||||||||||
| Effect of foreign exchange rate changes on cash from discontinued operations | ( |
||||||||||||||||
| Net change in cash and cash equivalents of discontinued operations | ( |
||||||||||||||||
| Net change in cash, cash equivalents and restricted cash | |||||||||||||||||
| Cash, cash equivalents and restricted cash at beginning of period (including discontinued operations) | |||||||||||||||||
| Cash, cash equivalents and restricted cash at end of period (including discontinued operations) | |||||||||||||||||
| Less: Cash, cash equivalents and restricted cash attributable discontinued operations at end of period | ( |
( |
|||||||||||||||
| Cash, cash equivalents and restricted cash at end of period | $ | $ | $ | ||||||||||||||
See Notes to Consolidated Financial Statements
93
SMITHFIELD FOODS, INC. AND SUBSIDIARIES
CONSOLIDATED STATEMENTS OF SHAREHOLDER’S EQUITY
(in millions)
|
Additional
Paid-in
Capital
|
Retained
Earnings
|
Accumulated
Other
Comprehensive
Loss
|
Total
Shareholder’s
Equity
|
Non-controlling Interests |
Total
Equity
|
||||||||||||||||||||||||||||||
| Balance, January 2, 2022 | $ | $ | $ | ( |
$ | $ | $ | ||||||||||||||||||||||||||||
| Dividends | — | ( |
— | ( |
— | ( |
|||||||||||||||||||||||||||||
| Adjustment to redeemable noncontrolling interests | ( |
— | — | ( |
— | ( |
|||||||||||||||||||||||||||||
| Comprehensive income: | |||||||||||||||||||||||||||||||||||
| Net income | — | — | — | ||||||||||||||||||||||||||||||||
| Other comprehensive loss, net of tax | — | — | ( |
( |
— | ( |
|||||||||||||||||||||||||||||
| Balance, January 1, 2023 | ( |
||||||||||||||||||||||||||||||||||
| Dividends | — | ( |
— | ( |
— | ( |
|||||||||||||||||||||||||||||
| Adjustment to redeemable noncontrolling interests | ( |
— | — | ( |
— | ( |
|||||||||||||||||||||||||||||
| Redemption of redeemable noncontrolling interest | — | — | — | — | — | — | |||||||||||||||||||||||||||||
| Comprehensive income: | |||||||||||||||||||||||||||||||||||
| Net income | — | — | — | ||||||||||||||||||||||||||||||||
| Other comprehensive income, net of tax | — | — | — | ||||||||||||||||||||||||||||||||
| Balance, December 31, 2023 | ( |
||||||||||||||||||||||||||||||||||
| Dividends | — | ( |
— | ( |
— | ( |
|||||||||||||||||||||||||||||
| Adjustment to redeemable noncontrolling interests | ( |
— | — | ( |
— | ( |
|||||||||||||||||||||||||||||
| European operations carve-out | ( |
( |
( |
— | ( |
||||||||||||||||||||||||||||||
| UGFH merger | — | — | — | ||||||||||||||||||||||||||||||||
| Other | ( |
— | — | ( |
— | ( |
|||||||||||||||||||||||||||||
| Comprehensive income: | |||||||||||||||||||||||||||||||||||
| Net income | — | — | — | ||||||||||||||||||||||||||||||||
| Other comprehensive loss, net of tax | — | — | ( |
( |
— | ( |
|||||||||||||||||||||||||||||
| Balance, December 29, 2024 | $ | $ | $ | ( |
$ | $ | $ | ||||||||||||||||||||||||||||
See Notes to Consolidated Financial Statements
94
SMITHFIELD FOODS, INC. AND SUBSIDIARIES
NOTES TO CONSOLIDATED FINANCIAL STATEMENTS
NOTE 1: SUMMARY OF SIGNIFICANT ACCOUNTING POLICIES
Organization
Smithfield Foods, Inc., together with its subsidiaries (“Smithfield,” “the Company,” “we,” “us” or “our”) produces a wide variety of packaged meats and fresh pork products primarily in the United States (“U.S.”) and markets them both domestically and internationally. We operate in a cyclical industry and our results are significantly affected by fluctuations in commodity prices for meat, livestock (primarily hogs) and grains. Smithfield is a majority-owned subsidiary of Hong Kong-based WH Group Limited (“WH Group”).
Basis of Presentation
The accompanying consolidated financial statements have been prepared in accordance with accounting principles generally accepted in the U.S. (“GAAP”), which require us to make estimates and use assumptions that affect the amounts reported in the consolidated financial statements and accompanying notes. It is possible that actual results could differ materially from those estimates. The information reflects all normal recurring adjustments which we believe are necessary to present fairly the financial position and results of operations for all periods included. Totals and percentages may be affected by rounding. Certain prior period amounts have been reclassified to conform to the current period presentation.
Our elected fiscal year is the 52-week or 53-week period which ends on the Sunday nearest to December 31. Fiscal years 2024, 2023 and 2022 each consisted of 52-weeks.
Principles of Consolidation
The consolidated financial statements include the accounts of all wholly owned subsidiaries, as well as all majority-owned subsidiaries and other entities for which we have a controlling financial interest. We evaluate contractual, equity and other variable interests in entities that may be deemed variable interest entities (“VIE”). We consolidate a VIE if we determine that we are the VIE’s primary beneficiary. A VIE’s primary beneficiary has both (1) the power to direct the activities of the VIE that most significantly impact the VIE’s economic performance and (2) the obligation to absorb losses or the right to receive benefits from the VIE that could potentially be significant to the VIE. All intercompany transactions and accounts have been eliminated.
The functional currency of our 66 %-owned subsidiary, Granjas Carroll de Mexico, S. de R.L. de C.V., (“Altosano”) is the Mexican Peso. The assets and liabilities of Altosano are translated into U.S. dollars using the exchange rates in effect at the balance sheet dates. The income and cash flows of Altosano are translated into U.S. dollars using the average exchange rates over the course of the year. The net effect of translating the accounts of Altosano into U.S. dollars is included as a component of shareholder’s equity in accumulated other comprehensive loss.
Cash and Cash Equivalents
Accounts Receivable, Net
Accounts receivable, net is comprised of both receivables from contracts with customers and other receivables. We monitor the credit risk associated with our accounts receivable and establish an allowance for credit losses expected
95
to be incurred over the life of the receivable, which is recorded net of this allowance. We calculate this allowance based on our history of write-offs, future economic conditions, level of past due accounts, the financial health of our customers and historical experience. Our allowance for credit losses was not material for the periods presented.
Inventories, Net
Inventories, net consist of the following:
| December 29, 2024 |
December 31, 2023 |
||||||||||
| (in millions) | |||||||||||
| Fresh and packaged meats | $ | $ | |||||||||
| Livestock | |||||||||||
| Grains | |||||||||||
| Manufacturing supplies | |||||||||||
| Maintenance parts | |||||||||||
| Other | |||||||||||
Inventories, net |
$ | $ | |||||||||
Inventories are generally valued at the lower of historical average cost or net realizable value. The cost of livestock includes feed, medications, contract grower fees and other production expenses. Fresh pork in the U.S. is valued based on U.S. Department of Agriculture (“USDA”) published market prices and adjusted for the cost of further processing. Costs for fresh and packaged meats include meat, labor, supplies and overhead. Manufacturing supplies principally consist of ingredients and packaging materials. We primarily use batch-specific costing to record the cost of inventories sold, which approximates the first-in, first-out method.
Derivative Financial Instruments and Hedging Activities
We record all derivatives as either assets or liabilities at fair value on the balance sheet, with the exception of contracts that qualify for the normal purchase and normal sale scope exception, which are expected to result in physical delivery. Accounting for changes in the fair value of a derivative depends on whether it qualifies and has been designated as part of a hedging relationship. For derivatives that qualify and have been designated as hedging instruments for accounting purposes, changes in fair value have no net impact on earnings, to the extent the derivative is considered perfectly effective in achieving offsetting changes in fair value attributable to the risk being hedged, until the hedged item is recognized in earnings (commonly referred to as the “hedge accounting” method). For derivatives that do not qualify or are not designated as hedging instruments for accounting purposes, changes in fair value are recorded in current period earnings (commonly referred to as the “mark-to-market” method). We may elect either method of accounting for our derivative portfolio, assuming all the necessary requirements are met. We have, in the past, availed ourselves of either acceptable method and expect to do so in the future. We believe all of our derivative instruments represent economic hedges against changes in prices and rates, regardless of their designation for accounting purposes.
When cash flow hedge accounting is applied, derivative gains or losses are recognized as a component of other comprehensive income (loss) and reclassified into earnings in the same period or periods during which the hedged transactions affect earnings. The initial fair value of hedge components excluded from the assessment of effectiveness is recognized in earnings on a straight-line basis over the life of the hedging instrument and is presented in the same income statement line item as the hedged item. Any difference between the change in fair value of the hedge components excluded from the assessment of effectiveness and the amounts recognized in earnings is recorded as a component of other comprehensive income (loss).
When fair value hedge accounting is applied, derivative gains and losses are recognized in earnings concurrently with the change in fair value of the hedged item attributable to the risk being hedged.
A portion of our derivatives are exchange traded futures contracts held with brokers, subject to netting arrangements that are enforceable during the ordinary course of business. Additionally, we have a portfolio of over-the-counter
96
derivatives that are held by counterparties under netting arrangements found in typical master netting agreements. These agreements legally allow for net settlement in the event of bankruptcy. We offset the fair values of derivative assets and liabilities, along with the related cash collateral, that are executed with the same counterparty under these arrangements in the consolidated balance sheets.
The cash flows associated with derivative instruments are reported in net cash flows from operating activities in the consolidated statements of cash flows.
Property, Plant and Equipment, Net
Property, plant and equipment, net, (“PP&E”) consists of the following:
| Useful Life | December 29, 2024 |
December 31, 2023 |
|||||||||||||||
| (in Years) | (in millions) | ||||||||||||||||
| Machinery and equipment | $ | $ | |||||||||||||||
| Buildings and improvements | |||||||||||||||||
| Land and improvements | |||||||||||||||||
| Computer hardware and software | |||||||||||||||||
| Breeding stock | |||||||||||||||||
| Vehicles | |||||||||||||||||
| Construction in progress | |||||||||||||||||
| Property, plant and equipment, gross | |||||||||||||||||
| Accumulated depreciation | ( |
( |
|||||||||||||||
| Finance leases | |||||||||||||||||
Property, plant and equipment, net |
$ | $ | |||||||||||||||
PP&E is generally stated at historical cost and depreciated on a straight-line basis over the estimated useful lives of the assets. Assets held under finance leases are classified in property, plant and equipment, net and depreciated over the lease term or, in the instance where title transfers to us at the end of the lease term, the estimated useful lives of the assets. The depreciation of assets held under finance leases is included in depreciation expense. Depreciation expense is included in either cost of sales or SG&A, as applicable. Accelerated depreciation of assets resulting from decisions to dispose of assets prior to the end of their previously estimated useful lives is included in cost of sales. Depreciation expense totaled $327 million, $395 million and $421 million in fiscal years 2024, 2023 and 2022, respectively.
During the construction period of significant assets, the associated interest costs are capitalized. Capitalized interest was not material for any of the fiscal years presented.
97
Goodwill
Goodwill represents the excess of the purchase price of a business over the fair value of identifiable net assets. The changes in goodwill allocated to each of our reportable segments for fiscal years 2024 and 2023 is presented in the following table.
| Packaged Meats | Fresh Pork | Hog Production |
Other (1)
|
Consolidated | |||||||||||||||||||||||||
| (in millions) | |||||||||||||||||||||||||||||
| Balance, January 1, 2023 | $ | $ | $ | $ | $ | ||||||||||||||||||||||||
| Foreign currency translation | $ | ||||||||||||||||||||||||||||
| Balance, December 31, 2023 | |||||||||||||||||||||||||||||
| Foreign currency translation | ( |
( |
|||||||||||||||||||||||||||
| Balance, December 29, 2024 | |||||||||||||||||||||||||||||
__________________
Goodwill for each reporting unit is tested for impairment annually in the fourth quarter, or sooner if impairment indicators arise. Goodwill is considered to be impaired if the carrying amount of a reporting unit exceeds its fair value, in which case an impairment loss would be recognized in an amount equal to that excess. We may perform a qualitative assessment to determine if it is more likely than not that the carrying amount of a reporting unit exceeds its fair value. If it is not, no further analysis is required. If it is, a quantitative goodwill impairment test is performed to estimate the fair value of the reporting unit and measure the amount of goodwill impairment loss to be recognized, if any.
The fair value of a reporting unit is estimated by applying valuation multiples and/or estimating future discounted cash flows. The selection of multiples is dependent upon assumptions regarding future operating performance as well as business trends and prospects, and industry, market and economic conditions. When estimating future discounted cash flows, we consider the assumptions that hypothetical marketplace participants would use in estimating future cash flows. In addition, where applicable, an appropriate discount rate is used, based on an industry-wide average cost of capital or location-specific economic factors. We consider all these factors to be level 3 inputs, as defined in “Note 16: Fair Value Measurements.”
98
Intangible Assets, Net
Intangible assets, net consists of the following:
| Useful Life | December 29, 2024 |
December 31, 2023 |
|||||||||||||||
| (in Years) | (in millions) | ||||||||||||||||
| Amortized intangible assets: | |||||||||||||||||
| Customer relationships | $ | $ | |||||||||||||||
| Contractual relationships | |||||||||||||||||
| Rights and customer lists | |||||||||||||||||
| Amortized intangible assets, gross | |||||||||||||||||
| Accumulated amortization | ( |
( |
|||||||||||||||
| Amortized intangible assets, net | |||||||||||||||||
| Non-amortized intangible assets: | |||||||||||||||||
| Trademarks | Indefinite | ||||||||||||||||
| Intangible assets, net | $ | $ | |||||||||||||||
| Year | (in millions) | |||||||
| 2025 | $ | |||||||
| 2026 | ||||||||
| 2027 | ||||||||
| 2028 | ||||||||
| 2029 | ||||||||
Indefinite-lived trademarks are tested for impairment annually in the fourth quarter, or sooner if impairment indicators arise. If the carrying amount of our trademarks exceed their estimated fair value, an impairment loss is recognized in an amount equal to that excess. The fair values of trademarks are calculated using a royalty rate method. Assumptions about royalty rates are based on the rates at which similar brands and trademarks are licensed in the marketplace.
We have determined that no impairments of our intangible assets existed for any of the fiscal years presented.
Investments
We account for investments in entities that we do not control, but over which we have the ability to exercise significant influence, using the equity accounting method. These investments are recorded in equity method investments on the consolidated balance sheet. We record our share of earnings and losses from our equity method investments in (income) loss from equity method investments in the consolidated statements of income. The majority of our equity method investments are reported on a one-month lag, which does not materially impact our consolidated financial statements.
We account for investments in entities that we do not control and do not have the ability to exercise significant influence at fair value if fair value is readily determinable. For investments that do not have readily determinable fair values, we account for the investment at cost minus impairment, if any, plus or minus changes resulting from orderly
99
transactions for the identical or a similar investment of the same issuer. These investments are recorded in other assets on the consolidated balance sheets.
Leases
At inception, we determine whether a contract is or contains a lease based on whether we have the right to control the use of an identified asset for a period of time, which includes the right to (1) obtain substantially all of the economic benefits from the use of the identified asset and (2) direct the use of the identified asset. Our lease assets and obligations are initially measured at the present value of the future lease payments over the term of the lease, adjusted for any prepayments. The lease term consists of the noncancellable period of the lease, plus any period covered by an option to extend the lease that is either controlled by the lessor or is reasonably certain to be exercised by the Company. The value of the future lease payments is discounted at the interest rate implicit in our lease contracts, if readily determinable. Otherwise, we utilize the appropriate incremental borrowing rate, which is the rate incurred to borrow on a collateralized basis over a similar term and economic environment to that of the lease. Our lease assets and obligations do not contain any leases with a term of 12 months or less.
Our lease agreements contain both lease and non-lease components. We allocate the consideration in our lease agreements to each component based on the standalone values of each component. The non-lease components are excluded from the measurement of our lease assets and obligations.
Operating lease cost is recognized on a straight-line basis in earnings over the term of the lease. Finance lease cost is amortized into earnings using the effective interest method over the lease term or, in the instance where title transfers to us at the end of the lease term, the estimated useful lives of the assets. The interest component of finance lease cost is included in interest expense.
Debt Issuance Costs, Premiums and Discounts
Income Taxes
We estimate total income tax expense, including interest and penalties, based on statutory tax rates and tax planning opportunities available to us in various jurisdictions in which we earn income. Federal income taxes include an estimate for taxes on earnings of foreign subsidiaries expected to be remitted to the U.S. and be taxable, but not for earnings considered indefinitely invested in the foreign subsidiary.
We account for the global intangible low-taxed income inclusion from foreign subsidiaries in the period in which it is incurred.
Deferred tax assets and liabilities are recognized for the estimated future tax consequences attributable to differences between the financial statement carrying amounts of assets and liabilities and their respective tax bases. Deferred tax assets and liabilities are measured using enacted tax rates in effect for the year in which those temporary differences are expected to be recovered or settled. The effect on deferred tax assets and liabilities of a change in tax rate is recognized in earnings in the period that includes the enactment date. Valuation allowances are established when necessary to reduce deferred tax assets to amounts more likely than not to be realized.
100
The determination of our provision for income taxes requires significant judgment, the use of estimates, and the interpretation and application of complex tax laws. Significant judgment is required in assessing the timing and amounts of deductible and taxable items.
Pension Accounting
We recognize the funded status of our defined benefit pension plans in the consolidated balance sheets. We measure our pension and other postretirement benefit plan obligations and related plan assets as of December 31. The measurement of our pension obligations and related costs is dependent on the use of assumptions and estimates. These assumptions include discount rates, salary growth, mortality rates and expected returns on plan assets. Changes in assumptions and future investment returns could potentially have a material impact on our expenses and related funding requirements.
We recognize in , the gains or losses and prior service costs or credits that arise during the period. Prior to the freeze of our qualified pension plans for all non-union participants in the second quarter of 2021, these amounts were amortized into net periodic benefit cost over the average remaining service period of active plan participants. Subsequent to the plan freeze, these amounts are amortized over the average remaining life expectancy of the plan participants.
Self-Insurance Programs
Asset Retirement Obligations
Contingent Liabilities
We are subject to lawsuits, investigations and other claims related to the operation of our farms and facilities, labor, livestock procurement, securities, environmental, our products, taxes and other matters, and are required to assess the likelihood of any adverse judgments or outcomes to these matters, as well as potential ranges of loss. A determination of the amount of accruals and disclosures required, if any, for these contingencies is made after considerable analysis of each individual issue.
101
We accrue for contingent liabilities, including future defense costs, when an assessment of the risk of loss is probable and can be reasonably estimated. We disclose contingent liabilities when the risk of material loss is at least reasonably possible. We reevaluate our accruals when facts and circumstances change, which could warrant an adjustment to the amount that is recorded.
Our contingent liabilities contain uncertainties because the eventual outcome will result from future events. Our determination of accruals and any reasonably possible losses in excess of those accruals require estimates and judgments related to the possible outcomes, differing interpretations of the law, assessments of the amount of potential damages, settlements or defense costs, and the effectiveness of strategies or other factors beyond our control. If actual results are not consistent with our estimates or assumptions, we may be exposed to gains or losses that could have a material effect on our future results of operations and cash flows.
Redeemable Noncontrolling Interests
| Twelve Months Ended | |||||||||||||||||
| December 29, 2024 |
December 31, 2023 |
January 1, 2023 |
|||||||||||||||
| (in millions) | |||||||||||||||||
| Beginning balance | $ | $ | $ | ||||||||||||||
| Attribution of net income | |||||||||||||||||
| Attribution of other comprehensive income (loss) | ( |
||||||||||||||||
| Dividends | ( |
( |
( |
||||||||||||||
| Redemption | ( |
||||||||||||||||
Adjustment to redemption value |
|||||||||||||||||
| Ending balance | $ | $ | $ | ||||||||||||||
Revenue Recognition
Our revenue (sales) is primarily derived from contracts with customers for the purchase of our products. Revenue is recognized at a point in time when our performance obligation has been satisfied and control of the promised goods is transferred to the customer, which generally occurs upon shipment or delivery to a customer based on terms of the sale. The primary performance obligation in our contracts with customers is to provide meat products. Shipping and handling activities are considered part of the fulfillment of our promise to provide meat products and not a separate performance obligation. Shipping and handling costs are reported as a component of cost of sales.
Revenue is recorded at the transaction price, which is the amount of consideration we expect to receive in exchange for providing goods to customers. The transaction price may be adjusted for estimates of known or expected variable consideration, including consumer incentives, trade promotions and other programs. Our estimates of variable consideration are based on a number of factors including history with the respective customer, current performance, and future projections. Additionally, in determining whether an estimate of variable consideration is constrained, we consider the likelihood and magnitude of a potential revenue reversal. We review and update these estimates regularly until the incentives or product returns are realized. The impact of any adjustment is recognized in the period in which the adjustment is identified. Payment terms vary per contract. However, payment is typically received within a few weeks of the invoice date.
102
The balances for receivables from contracts with customers and deferred revenue are presented in the following table:
| December 29, 2024 |
December 31, 2023 |
January 1, 2023 |
|||||||||||||||
| (in millions) | |||||||||||||||||
| Receivables from contracts with customers | $ | $ | $ | ||||||||||||||
| Deferred revenue | |||||||||||||||||
Advertising and Promotional Expenses
Research and Development Expenses
Research and development expenses are recognized as incurred. Research and development expenses totaled $144 million, $175 million and $157 million in fiscal years 2024, 2023 and 2022, respectively, and are included in cost of sales in the consolidated statements of income.
Government Assistance
Recently Issued Accounting Pronouncements
New Accounting Pronouncements Recently Adopted
In November 2023, the Financial Accounting Standards Board (“FASB”) issued Accounting Standards Update (“ASU”) 2023-07, Segment Reporting (Topic 280): Improvements to Reportable Segment Disclosures. The guidance requires, among other things, disclosure of significant segment expenses which are regularly provided to the Chief Operating Decision Maker (“CODM”), the CODM’s title and position within the organization, and how the CODM uses the reported measure to assess segment performance and make resource allocation decisions. The guidance was adopted and applied in this Annual Report on Form 10-K. See “Note 2: Reportable Segments” for the required disclosures.
New Accounting Pronouncements Not Yet Adopted
In December 2023, the FASB issued ASU No. 2023-09, Income Taxes (Topic 740): Improvements to Income Tax Disclosures. The standard requires enhanced rate reconciliation disclosures, including disclosure of specific categories and additional information for reconciling items that meet a quantitative threshold. The standard also requires companies to disaggregate income taxes paid by federal, state and foreign taxes. The update is effective for fiscal year 2025, with early adoption permitted. The standard will not impact our financial position, results of operations or cash flows.
In November 2024, the FASB issued ASU 2024-03, Income Statement—Reporting Comprehensive Income—Expense Disaggregation Disclosures (Subtopic 220-40): Disaggregation of Income Statement Expenses. The new guidance is intended to provide investors more disaggregated information about certain line items presented in the consolidated statement of income. The update is effective for fiscal year 2027, with early adoption permitted. The new disclosures are required to be applied prospectively with the option for retrospective application. The standard will not impact our financial position, results of operations or cash flows.
103
NOTE 2: REPORTABLE SEGMENTS
Our reportable segments are determined on the basis of our organizational structure and information that is regularly reviewed by our CODM for the purpose of making operating and resource allocation decisions and assessing the performance of the operating segments of our business. Our CODM is our Chief Executive Officer. Our CODM reviews assets at a consolidated level; not by reportable segment. Therefore, we do not disclose assets by reportable segment.
The measure of segment profit reviewed by our CODM is operating profit, which represents the operating results of our operating segments with the exception of certain gains, losses and other expenses which are not allocated to our segments. Our CODM uses operating profit to assess segment performance, compensate employees and allocate capital, personnel and other resources to each segment. We recently removed income from equity method investments from the measure of segment profit reviewed by our CODM. Accordingly, the historical segment results presented herein have been retrospectively adjusted to remove income from equity method investments.
Following the carve-out and distribution of our European operations (see “Note 3: Discontinued Operations”), we conduct our operations through three reportable segments: Packaged Meats, Fresh Pork and Hog Production.
Packaged Meats
The Packaged Meats segment consists of our U.S. operations that process fresh meat into a wide variety of packaged meats products, including bacon, sausage, hot dogs, deli and lunch meats, dry sausage products (such as pepperoni and genoa), ham products, ready-to-eat products and prepared foods (such as pre-cooked entrees, bacon and sausage). Approximately 80 % of the Packaged Meats segment’s raw materials are sourced from our Fresh Pork segment. We market our domestic packaged meats products under a strategic set of core brands, which include: Smithfield, Eckrich, Nathan’s Famous, Farmland, Armour, Farmer John, Kretschmar, Krakus, John Morrell, Cook’s, Gwaltney, Carando, Margherita, Curly’s and Smithfield Culinary. We also sell a sizeable portion of our packaged meats products as private label products. The majority of the Packaged Meats segment’s products are sold to retail and foodservice customers in the U.S.
Fresh Pork
The Fresh Pork segment consists of our U.S. operations that process live hogs into a wide variety of primal, sub-primal and offal products, such as bellies, butts, hams, loins, picnics and ribs. In fiscal year 2024, the Fresh Pork segment sourced approximately half of its raw materials from our Hog Production segment and half from independent farmers with whom we partner across the U.S. Approximately one-third of our fresh pork products, including the majority of hams, bellies and trimmings, is transferred to our Packaged Meats segment. Externally, we sell our fresh pork products to domestic retail, foodservice and industrial customers, as well as to export markets, including, among others, China, Mexico, Japan, South Korea and Canada.
Hog Production
The Hog Production segment consists of our hog production operations in the U.S., which produce and raise our hogs on numerous company-owned farms and farms that are owned and operated by third-party contract farmers. Nearly all of the hogs produced by this segment are processed by our Fresh Pork segment. The Hog Production segment also may sell grains to external customers.
The following table provides certain financial information by reportable segment for the fiscal years presented with a reconciliation to the consolidated totals.
104
| Fiscal Year 2024 | |||||||||||||||||||||||||||||||||||||||||||||||
| Packaged Meats | Fresh Pork | Hog Production |
Other (1)
|
Corporate (2)
|
Unallocated (3)
|
Intersegment | Consolidated | ||||||||||||||||||||||||||||||||||||||||
| (in millions) | |||||||||||||||||||||||||||||||||||||||||||||||
| Sales | ( |
$ | |||||||||||||||||||||||||||||||||||||||||||||
| Cost of sales | ( |
||||||||||||||||||||||||||||||||||||||||||||||
| Selling, general and administrative expenses | |||||||||||||||||||||||||||||||||||||||||||||||
| Operating gains | ( |
( |
( |
||||||||||||||||||||||||||||||||||||||||||||
| Operating profit (loss) | ( |
( |
( |
||||||||||||||||||||||||||||||||||||||||||||
| Interest expense, net | |||||||||||||||||||||||||||||||||||||||||||||||
| Non-operating gains | ( |
( |
|||||||||||||||||||||||||||||||||||||||||||||
| Income from continuing operations before income taxes | |||||||||||||||||||||||||||||||||||||||||||||||
| Other segment data: | |||||||||||||||||||||||||||||||||||||||||||||||
| Depreciation and amortization | |||||||||||||||||||||||||||||||||||||||||||||||
| Capital expenditures | |||||||||||||||||||||||||||||||||||||||||||||||
| Fiscal Year 2023 | |||||||||||||||||||||||||||||||||||||||||||||||
| Packaged Meats | Fresh Pork | Hog Production |
Other (1)
|
Corporate (2)
|
Unallocated (3)
|
Intersegment | Consolidated | ||||||||||||||||||||||||||||||||||||||||
| (in millions) | |||||||||||||||||||||||||||||||||||||||||||||||
Sales |
$ | $ | $ | $ | $ | $ | ( |
$ | |||||||||||||||||||||||||||||||||||||||
| Cost of sales | ( |
||||||||||||||||||||||||||||||||||||||||||||||
| Selling, general and administrative expenses | |||||||||||||||||||||||||||||||||||||||||||||||
| Operating gains | ( |
( |
|||||||||||||||||||||||||||||||||||||||||||||
| Operating profit (loss) | ( |
( |
( |
( |
( |
||||||||||||||||||||||||||||||||||||||||||
| Interest expense, net | |||||||||||||||||||||||||||||||||||||||||||||||
Non-operating gains |
( |
( |
|||||||||||||||||||||||||||||||||||||||||||||
| Loss from continuing operations before income taxes | ( |
||||||||||||||||||||||||||||||||||||||||||||||
| Other segment data: | |||||||||||||||||||||||||||||||||||||||||||||||
| Depreciation and amortization | |||||||||||||||||||||||||||||||||||||||||||||||
| Capital expenditures | |||||||||||||||||||||||||||||||||||||||||||||||
105
| Fiscal Year 2022 | |||||||||||||||||||||||||||||||||||||||||||||||
| Packaged Meats | Fresh Pork | Hog Production |
Other (1)
|
Corporate (2)
|
Unallocated (3)
|
Intersegment | Consolidated | ||||||||||||||||||||||||||||||||||||||||
| (in millions) | |||||||||||||||||||||||||||||||||||||||||||||||
Sales |
$ | $ | $ | $ | $ | $ | ( |
$ | |||||||||||||||||||||||||||||||||||||||
| Cost of sales | ( |
||||||||||||||||||||||||||||||||||||||||||||||
| Selling, general and administrative expenses | |||||||||||||||||||||||||||||||||||||||||||||||
| Operating gains | ( |
( |
|||||||||||||||||||||||||||||||||||||||||||||
| Operating profit (loss) | ( |
( |
|||||||||||||||||||||||||||||||||||||||||||||
| Interest expense, net | |||||||||||||||||||||||||||||||||||||||||||||||
Non-operating gains |
( |
( |
|||||||||||||||||||||||||||||||||||||||||||||
Income from continuing operations before income taxes |
|||||||||||||||||||||||||||||||||||||||||||||||
| Other segment data: | |||||||||||||||||||||||||||||||||||||||||||||||
| Depreciation and amortization | |||||||||||||||||||||||||||||||||||||||||||||||
| Capital expenditures | |||||||||||||||||||||||||||||||||||||||||||||||
(1)Includes our Mexico and Bioscience operations. Our Mexico operations include the raising of hogs and production of pork products that are sold primarily to customers in Mexico. Our Bioscience operations use raw materials from hogs that we harvest to manufacture heparin products, including an active pharmaceutical ingredient that mitigates the risk of blood clots.
(2)Represents general corporate expenses for management and administration of the business.
(3)Includes certain costs of sales, SG&A and operating gains that we do not allocate to our segments.
106
The following table disaggregates our sales to customers by reportable segment and by major distribution channel:
| Fiscal Year 2024 | |||||||||||||||||||||||||||||||||||||||||||||||
Retail (1)
|
Foodservice (2)
|
Exports (3)
|
Industrial (4)
|
Other / Unallocated (5)
|
Total External Sales (6)
|
Intersegment |
Consolidated (7)
|
||||||||||||||||||||||||||||||||||||||||
| (in millions) | |||||||||||||||||||||||||||||||||||||||||||||||
| Packaged Meats | $ | $ | $ | $ | $ | $ | $ | $ | |||||||||||||||||||||||||||||||||||||||
| Fresh Pork | |||||||||||||||||||||||||||||||||||||||||||||||
| Hog Production | |||||||||||||||||||||||||||||||||||||||||||||||
Other (8)
|
— | — | — | — | |||||||||||||||||||||||||||||||||||||||||||
| Intersegment | — | — | — | — | — | — | ( |
( |
|||||||||||||||||||||||||||||||||||||||
| Total | $ | $ | $ | $ | $ | $ | $ | — | $ | ||||||||||||||||||||||||||||||||||||||
| Fiscal Year 2023 | |||||||||||||||||||||||||||||||||||||||||||||||
Retail (1)
|
Foodservice (2)
|
Exports (3)
|
Industrial (4)
|
Other / Unallocated (5)
|
Total External Sales (6)
|
Intersegment |
Consolidated (7)
|
||||||||||||||||||||||||||||||||||||||||
| (in millions) | |||||||||||||||||||||||||||||||||||||||||||||||
| Packaged Meats | $ | $ | $ | $ | $ | $ | $ | $ | |||||||||||||||||||||||||||||||||||||||
| Fresh Pork | |||||||||||||||||||||||||||||||||||||||||||||||
| Hog Production | |||||||||||||||||||||||||||||||||||||||||||||||
Other (8)
|
— | — | — | — | |||||||||||||||||||||||||||||||||||||||||||
| Intersegment | — | — | — | — | — | — | ( |
( |
|||||||||||||||||||||||||||||||||||||||
| Total | $ | $ | $ | $ | $ | $ | $ | — | $ | ||||||||||||||||||||||||||||||||||||||
| Fiscal Year 2022 | |||||||||||||||||||||||||||||||||||||||||||||||
Retail (1)
|
Foodservice (2)
|
Exports (3)
|
Industrial (4)
|
Other / Unallocated (5)
|
Total External Sales (6)
|
Intersegment |
Consolidated (7)
|
||||||||||||||||||||||||||||||||||||||||
| (in millions) | |||||||||||||||||||||||||||||||||||||||||||||||
| Packaged Meats | $ | $ | $ | $ | $ | $ | $ | $ | |||||||||||||||||||||||||||||||||||||||
| Fresh Pork | |||||||||||||||||||||||||||||||||||||||||||||||
| Hog Production | |||||||||||||||||||||||||||||||||||||||||||||||
Other (8)
|
— | — | — | — | |||||||||||||||||||||||||||||||||||||||||||
| Intersegment | — | — | — | — | — | — | ( |
( |
|||||||||||||||||||||||||||||||||||||||
| Total | $ | $ | $ | $ | $ | $ | $ | — | $ | ||||||||||||||||||||||||||||||||||||||
________________
(1)Includes national and regional retailers in the U.S. such as grocery supermarket chains, independent grocers and club stores.
(2)Includes foodservice distributors, fast food and other restaurant operators, hotel chains and other institutional customers in the U.S.
(3)Includes exports from the U.S. to international retailers and wholesale distributors primarily in North America, Asia, Latin America and other emerging markets.
(4)Includes sales to industrial customers who use our raw materials in their finished goods production, including prepared meals, pharmaceutical production and pet food.
(5)Includes sales of grain, oilseeds, breeding stock and market hogs, among others, in addition to external sales from our Mexico and Bioscience operations.
(6)Includes external sales from our Mexico operations of $431 million, $515 million, and $444 million in fiscal years 2024, 2023 and 2022, respectively. All other external sales are sourced from our U.S. operations.
(7)Our largest customer, Walmart Inc. (“Walmart”), accounted for 13 %, 12 % and 12 % of consolidated sales in fiscal years 2024, 2023 and 2022, respectively. Sales to Walmart were included in our Packaged Meats and Fresh Pork segments. Any extended discontinuance of sales to this customer could, if not replaced, have a material impact on our results of operations.
(8)Includes our Mexico and Bioscience operations.
107
NOTE 3: DISCONTINUED OPERATIONS
On August 26, 2024, we completed a carve-out and distribution of our European operations to WH Group. The European carve-out represents a strategic shift in our geographical footprint. Accordingly, the results of operations, assets and liabilities, and cash flows of the European operations have been condensed into separate line items and presented in the consolidated statements of income, the consolidated balance sheets and the consolidated statements of cash flows as discontinued operations and this treatment has been applied retrospectively to all periods presented.
The following table presents the major components of net income from discontinued operations included in the consolidated statements of income.
| Fiscal Year | |||||||||||||||||
| 2024 | 2023 | 2022 | |||||||||||||||
| (in millions) | |||||||||||||||||
| Sales | $ | $ | $ | ||||||||||||||
| Cost of sales | |||||||||||||||||
| Gross profit | |||||||||||||||||
| Selling, general and administrative expenses | |||||||||||||||||
Operating gains |
( |
( |
( |
||||||||||||||
| Operating profit | |||||||||||||||||
| Interest expense | |||||||||||||||||
| Non-operating losses | |||||||||||||||||
| Income from discontinued operations before income taxes | |||||||||||||||||
Income tax on discontinued operations (1)
|
|||||||||||||||||
| Net income from discontinued operations | $ | $ | $ | ||||||||||||||
________________
(1)Income tax on discontinued operations for 2024 includes a $22 million income tax benefit recognized as a result of the carve-out of our European operations.
The following tables present the carrying amounts of the major classes of assets and liabilities of the discontinued operations included in the consolidated balance sheets.
Assets
| December 29, 2024 |
December 31, 2023 |
||||||||||
| Current assets: | |||||||||||
| Cash and cash equivalents | $ | $ | |||||||||
| Accounts receivable, net | |||||||||||
Inventories, net |
|||||||||||
| Prepaid expenses and other current assets | |||||||||||
| Total current assets | |||||||||||
| Property, plant and equipment, net | |||||||||||
| Goodwill | |||||||||||
| Intangible assets, net | |||||||||||
| Other assets | |||||||||||
| Total long-term assets | $ | $ | |||||||||
108
Liabilities
| December 29, 2024 |
December 31, 2023 |
||||||||||
| Current liabilities: | |||||||||||
| Accounts payable | $ | $ | |||||||||
| Current portion of long-term debt and finance lease obligations | |||||||||||
| Accrued expenses and other current liabilities | |||||||||||
| Total current liabilities | |||||||||||
| Deferred income taxes, net | |||||||||||
| Long-term debt and finance lease obligations | |||||||||||
| Other liabilities | |||||||||||
| Total long-term liabilities | $ | $ | |||||||||
Acquisitions within our Discontinued Operations
Prior to the carve-out and distribution of our European operations, we completed several acquisitions, which are included in discontinued operations.
Goodies
On February 28, 2023, our former European operations purchased Goodies Meat Production S.R.L. (“Goodies”), a Romanian producer of private label packaged meats products, for consideration valued at €29 million ($31 million). The amount paid was €24 million ($26 million) including post-closing adjustments. The consideration includes contingent payments of €5 million, payable upon the achievement of certain earnings targets over a two-year period. Goodies operates a production facility in Ceptura de Jos, Romania and employs 320 people. Their portfolio of products includes salami, ham, bacon, bologna and other meat specialties.
DeVeris
On May 31, 2023, our former European operations acquired an 80 % interest in DeVeris Polska Sp. z o.o. (“DeVeris”), a Polish processor of poultry by-products, for 48 million zł ($11 million). DeVeris operates a production facility in Turek, Poland. The acquisition of DeVeris expanded the vertically integrated business in Poland by enabling further processing of both pork and poultry by-products.
Argal
On March 28, 2024, our former European operations purchased a 50.1 % stake in Argal Alimentacíon, S.A. (“Argal”), a Spanish producer of packaged meats products with approximately 1,480 employees, for €91 million ($98 million), subject to post-closing adjustments. The amount paid at closing was €82 million ($88 million) with the remaining balance due upon finalization of the purchase price. In August 2024, an additional €8 million ($9 million) was paid, which resulted in a final purchase price of €90 million ($97 million).
Continuing Involvement
In connection with the carve-out of our European operations (“Morliny Foods”), we entered into a transition services agreement that governs certain services Smithfield will provide to Morliny Foods for up to a year subsequent to the carve-out. These services include information technology support, including access and license fees, tax advisory services and financial reporting services, none of which are material to Smithfield. In addition, Smithfield will continue to purchase certain products from Morliny Foods for distribution in the U.S. market. Purchases of these products from Morliny Foods were $45 million, $33 million and $62 million in fiscal years 2024, 2023 and 2022, respectively.
109
NOTE 4: MERGERS, ACQUISITIONS AND DISPOSITIONS
UGFH Merger
On December 29, 2024, United Global Foods Holdings (US), Inc. (“UGFH”), our immediate parent company, merged with Smithfield, resulting in Smithfield being the surviving entity. This transaction represented a common control transfer applied prospectively in the Company’s financial statements. As a result of the merger, the accounts of UGFH were added to our consolidated balance sheet, which was impacted as follows:
| December 29, 2024 |
|||||
| (in millions) | |||||
Prepaid expenses and other current assets |
$ | ||||
Deferred income taxes, net |
( |
||||
Additional paid-in capital |
$ | ||||
Acquisitions
American Skin
On December 28, 2023, we acquired the remaining 15 % interest in American Skin Food Group, LLC for $15 million.
Dry Sausage Facility
On July 30, 2024, we acquired a dry sausage production facility located in Nashville, Tennessee from Cargill Meat Solutions Corporation for $38 million. The acquisition is part of our strategy to grow our value-added packaged meats business and serve the growing demand for high-quality pepperoni, deli, charcuterie and other dry sausage products. The total cost of the asset acquisition was allocated based on the relative fair value of the assets acquired. The allocated fair values of the assets acquired are as follows: equipment valued at $17 million, buildings valued at $11 million, inventory valued at $5 million and land valued at $5 million.
Dispositions
Saratoga
On October 31, 2022 we closed on the sale of our Saratoga Specialty Foods operation (“Saratoga”), which produced spices, seasonings and sauces for sale primarily to the foodservice industry and for use in our internal production of various packaged meats products. Saratoga continues to be a supplier of ours subsequent to the sale. Proceeds totaled $575 million, resulting in a $417 million gain on the disposal. The gain was recognized in in the consolidated statement of income in the fourth quarter of 2022. The carrying amount of assets disposed of included $47 million of allocated goodwill. We received $568 million of proceeds at closing. The remainder was received in the first quarter of fiscal year 2023. Saratoga was accounted for in the Packaged Meats segment.
Altoona, Iowa Facility Closure
On August 30, 2024, we closed our Altoona, Iowa ham boning facility and consolidated production volume into other locations to improve manufacturing efficiencies. Costs associated with closing the plant primarily include operating lease assets and equipment that we disposed of prior to the expiration of the lease term or end of the asset’s useful life. The charges associated with the closing were not material. Altoona was accounted for in the Fresh Pork segment.
110
NOTE 5: OPERATING GAINS AND NON-OPERATING GAINS
The following table provides details of operating gains and non-operating gains.
| Fiscal Year | |||||||||||||||||
| 2024 | 2023 | 2022 | |||||||||||||||
| (in millions) | |||||||||||||||||
Operating gains: |
|||||||||||||||||
Gain on disposal of assets (1)
|
$ | ( |
$ | ( |
$ | ||||||||||||
Insurance recoveries |
( |
( |
( |
||||||||||||||
Gain on sale of businesses (2)
|
( |
( |
|||||||||||||||
| Other operating gains | ( |
( |
( |
||||||||||||||
Total operating gains |
$ | ( |
$ | ( |
$ | ( |
|||||||||||
Non-operating gains: |
|||||||||||||||||
| (Gain) loss on nonqualified retirement plan assets | $ | ( |
$ | ( |
$ | ||||||||||||
Gain on the sale/dilution of equity method investments (3)
|
( |
||||||||||||||||
Impairment of investment (4)
|
|||||||||||||||||
Net pension and postretirement benefits cost (benefit) (5)
|
( |
||||||||||||||||
| Other non-operating (gains) losses | ( |
||||||||||||||||
Total non-operating gains |
$ | ( |
$ | ( |
$ | ( |
|||||||||||
________________
(1)Fiscal year 2024 includes a $32 million gain on the sale of hog farms in Utah and a $6 million gain on the sale of assets to Murphy Family Farms LLC (“Murphy Family Farms”). Fiscal year 2023 includes an $86 million gain on the sale of our Vernon, California plant. See “Note 6: Restructuring” for further information.
(2)Fiscal year 2022 includes the $417 million gain on the sale of Saratoga.
(3)In February 2022, our interest in Monarch Bioenergy LLC (“Monarch”), was reduced from 50 % to 33 % upon the issuance of additional shares to a new investor. The transaction was accounted for as a partial sale of our investment, which resulted in a $52 million gain. In addition, in November 2022, we sold our shares in Norson Holding, S. de R.L. de C.V. (“Norson”) to our joint venture partner and recognized a $4 million gain on the sale in non-operating gains in the fourth quarter of 2022.
(4)In the first quarter of fiscal year 2022, we wrote down the value of our former investment in Norson by $40 million to its estimated fair value.
(5)Includes the components of net pension and postretirement benefits cost other than service cost, which is included in operating profit. These components consist of interest cost, expected return on plan assets, amortization of actuarial gains/losses and prior service costs/credits, and curtailment gains.
NOTE 6: RESTRUCTURING
In May 2022, we announced a decision to close our Vernon, California processing facility, exit farm operations in Arizona and California and reduce our sow herd in Utah. The decision to permanently close our Vernon facility was based on increasingly difficult business conditions in California, where high taxes, high utility costs and a challenging regulatory environment negatively impact our ability to operate efficiently and profitably.
In December 2023, we made a decision to terminate a number of third-party hog grower contracts and close several company-owned nursery farms in Utah as a result of the Vernon facility closure in early fiscal year 2023.
Additionally, we have taken a number of actions to further restructure and optimize the size of our hog production operations, including:
•In May 2023, we made a decision to cease operations on a number of sow farms in Missouri. The decision was driven by persistent livestock disease issues, underperforming operations and shifting industry supply and demand dynamics.
111
•In fiscal years 2023 and 2024, we terminated certain agreements with underperforming contract farmers and closed certain farms in the eastern U.S.
•On December 27, 2024, we became a member of a North Carolina-based company, Murphy Family Farms, by contributing $3 million in cash in exchange for a 25 % minority interest. We additionally sold approximately 150,000 sows and related inventories located on company-owned and contract farms in North Carolina to Murphy Family Farms and recorded a gain of $6 million on the sale. Subsequent to the end of our fiscal year 2024, on December 30, 2024, we sold the commercial hog inventories associated with such sows to Murphy Family Farms. Murphy Family Farms is now a hog supplier to us and will supply approximately 3.2 million hogs annually. We will supply animal feed and other supplies and provide certain support services to Murphy Family Farms.
•On February 24, 2025, we became a member of a North Carolina-based company, VisionAg Hog Production, LLC (“VisionAg”), by contributing $450,000 in cash in exchange for a 9 % minority interest. We additionally sold approximately 28,000 sows and the associated commercial hog inventories located on certain company-owned and contract farms in North Carolina to VisionAg. VisionAg is now a hog supplier to us and will supply approximately 600,000 hogs annually. In addition, we will supply animal feed and provide certain support services to VisionAg.
As a result of these decisions, we incurred various exit costs and disposal charges, which have been recorded in in our consolidated statements of income. The following table details the charges by major type of cost.
Fiscal Year |
Cumulative | ||||||||||||||||||||||
| 2024 | 2023 | 2022 | |||||||||||||||||||||
| (in millions) | |||||||||||||||||||||||
Accelerated depreciation (1)
|
$ | $ | $ | $ | |||||||||||||||||||
| Contract termination costs | |||||||||||||||||||||||
| Employee termination benefits | |||||||||||||||||||||||
Loss on asset disposals (2)
|
|||||||||||||||||||||||
| Other exit costs | |||||||||||||||||||||||
| Total | $ | $ | $ | $ | |||||||||||||||||||
________________
(1)Accelerated depreciation includes $11 million and $20 million for AROs in fiscal years 2023 and 2022, respectively, which were recorded in connection with the decisions to close certain Company-owned farms in accordance with our general permit for concentrated animal feeding operations in the State of Utah.
(2)On November 26, 2024, we sold certain hog farms in Missouri for $32 million. The transaction resulted in a loss of $4 million.
The following table reconciles the beginning and ending liability balances associated with these restructuring activities.
| Balance, January 1, 2023 | Additions | Payments | Balance, December 31, 2023 | Additions | Payments | Balance, December 29, 2024 | |||||||||||||||||||||||||||||||||||
| (in millions) | |||||||||||||||||||||||||||||||||||||||||
| Contract termination costs | $ | $ | $ | ( |
$ | $ | $ | ( |
$ | ||||||||||||||||||||||||||||||||
| Employee termination benefits | ( |
( |
|||||||||||||||||||||||||||||||||||||||
| Other exit costs | ( |
( |
|||||||||||||||||||||||||||||||||||||||
| Total | $ | $ | $ | ( |
$ | $ | $ | ( |
$ | ||||||||||||||||||||||||||||||||
112
Certain of these actions impacted our biogas joint ventures for which we recognized additional costs and losses not included in the table above:
•In the fourth quarter of fiscal year 2023, we incurred $14 million in costs associated with biogas assets owned by our joint venture, Monarch, in connection with the farms in Missouri that were closed in fiscal year 2023. These costs were recognized in (income) loss from equity method investments in the consolidated statement of income.
•Additionally, in the fourth quarter of fiscal year 2023, certain biogas assets owned by our joint venture, Align RNG, LLC (“Align”), were impaired as a result of our decision in December 2023 to terminate hog grower contracts and close farms in Utah. As a result, we recognized our share of the impairment totaling $35 million in (income) loss from equity method investments in the consolidated income statement.
Also, following the restructuring activities outlined above, we sold certain properties and recognized gains, which were not included in the table above:
•In the second quarter of fiscal year 2023, we sold our Vernon, California facility for $205 million and recognized a gain of $86 million in operating gains in the consolidated statement of income.
NOTE 7: EMPLOYEE RETENTION TAX CREDITS
In 2020, the World Health Organization publicly characterized COVID-19 as a pandemic. The Company recognized a substantial amount of incremental costs during the pandemic, including costs to compensate employees who were not able to work due to facility closures, reduced work schedules or health related reasons.
The Coronavirus Aid, Relief, and Economic Security Act was signed into law in March 2020, which provided, among other things, an employee retention credit to eligible employers who paid qualified wages to employees during the pandemic. The employee retention credit represents a government grant. Our policy is to recognize government grants when they are reasonably assured of receipt. In the second quarter of 2024, we concluded the recognition threshold had been met and therefore, recognized $86 million and $1 million of employee retention credits in cost of sales and SG&A, respectively, in the consolidated statement of income.
NOTE 8: DERIVATIVE FINANCIAL INSTRUMENTS
Our pork production operations use various raw materials, primarily live hogs, corn, soybean meal and wheat, which are actively traded on commodity exchanges. We also use fuel and other energy commodities in our operations. We hedge these commodities when we determine conditions are appropriate to mitigate price risk. While this hedging may limit our ability to participate in gains from favorable commodity fluctuations, it also reduces the risk of loss from adverse changes in raw material prices. We attempt to closely match the commodity contract terms with the hedged item. We also periodically enter into interest rate swaps to hedge exposure to changes in interest rates on certain financial instruments and foreign exchange forward contracts to hedge certain exposures to fluctuating foreign currency rates.
Changes in commodity prices could have a significant impact on cash deposit requirements under our broker and counterparty agreements. Additionally, certain of our derivative contracts contain credit risk-related contingent features, which would require us to post additional cash collateral to cover net losses on open derivative instruments if our credit rating were sufficiently downgraded. As of December 29, 2024, the net liability position of our open derivative instruments that are subject to credit risk-related contingent features was not material.
Although our counterparties primarily consist of financial institutions that are investment grade, we would be exposed to losses in the event of nonperformance or nonpayment by our counterparties. However, a portion of our
113
financial instruments are exchange traded derivative contracts held with brokers and counterparties with whom we maintain margin accounts that are settled on a daily basis, thereby limiting our credit exposure to non-exchange traded derivatives. Determination of the credit quality of our counterparties is based upon a number of factors, including credit ratings and our evaluation of their financial condition. As of December 29, 2024, we had gross credit exposure of $4 million on non-exchange traded derivative contracts. After taking into account the effect of netting arrangements, we had no credit exposure on non-exchange traded derivative contracts.
The size and mix of our derivative portfolio vary from time to time based upon our analysis of current and future market conditions. The following table presents the fair values of our open derivative financial instruments on a gross basis.
| Assets | Liabilities | |||||||||||||||||||||||||
| December 29, 2024 |
December 31, 2023 |
December 29, 2024 |
December 31, 2023 |
|||||||||||||||||||||||
| (in millions) | (in millions) | |||||||||||||||||||||||||
Derivatives using the “hedge accounting” method: |
||||||||||||||||||||||||||
| Commodity contracts | $ | $ | $ | $ | ||||||||||||||||||||||
| Foreign exchange contracts | ||||||||||||||||||||||||||
| Total | ||||||||||||||||||||||||||
Derivatives using the “mark-to-market” method: |
||||||||||||||||||||||||||
| Commodity contracts | ||||||||||||||||||||||||||
| Total fair value of derivative instruments | $ | $ | $ | $ | ||||||||||||||||||||||
The following tables reconcile the gross amounts of derivative assets and liabilities to the net amounts presented in our consolidated balance sheets and the related effects of cash collateral under netting arrangements that provide a legal right of offset of assets and liabilities.
| December 29, 2024 | |||||||||||||||||||||||||||||
| Gross Amount of Derivative Assets/ Liabilities | Netting of Derivative Assets/ Liabilities | Net Derivative Assets/Liabilities | Netting of Derivative and Cash Collateral |
Net Amount Presented in the Consolidated Balance Sheet (1)
|
|||||||||||||||||||||||||
| (in millions) | |||||||||||||||||||||||||||||
| Assets: | |||||||||||||||||||||||||||||
| Commodities | $ | $ | ( |
$ | $ | $ | |||||||||||||||||||||||
| Liabilities: | |||||||||||||||||||||||||||||
| Commodities | ( |
( |
|||||||||||||||||||||||||||
________________
(1)Net derivative assets are recorded in prepaid expenses and other current assets. Net derivative liabilities are recorded in accrued expenses and other current liabilities. These balances include $60 million in cash collateral paid to and held by one of our brokers, $37 million of which represents the initial margin and exceeded the related open derivative liability position.
114
| December 31, 2023 | |||||||||||||||||||||||||||||
| Gross Amount of Derivative Assets/ Liabilities | Netting of Derivative Assets/ Liabilities | Net Derivative Assets/Liabilities | Netting of Derivative and Cash Collateral |
Net Amount Presented in the Consolidated Balance Sheet (1)
|
|||||||||||||||||||||||||
| (in millions) | |||||||||||||||||||||||||||||
| Assets: | |||||||||||||||||||||||||||||
| Commodities | $ | $ | ( |
$ | $ | ( |
$ | ||||||||||||||||||||||
| Foreign exchange contracts | |||||||||||||||||||||||||||||
| Total | $ | $ | ( |
$ | $ | ( |
$ | ||||||||||||||||||||||
| Liabilities: | |||||||||||||||||||||||||||||
| Commodities | ( |
||||||||||||||||||||||||||||
________________
(1)We recorded $25 million of net assets in prepaid expenses and other current assets with the remaining $1 million in current assets of discontinued operations. We recorded $14 million of the net liabilities in accrued expenses and other current liabilities with the remaining $5 million in other liabilities.
Hedge Accounting Method
Cash Flow Hedges
We enter into derivative instruments, such as futures, swaps and options contracts, to manage our exposure to the variability in expected future cash flows attributable to commodity price risk associated with the forecasted sale of fresh pork and the forecasted purchase of grains, hogs, and energy. In addition, we enter into interest rate swaps to manage our exposure to changes in interest rates associated with our variable interest rate debt and the forecasted issuance of fixed rate debt. Lastly, we enter into foreign exchange contracts to manage our exposure to the variability in expected future cash flows attributable to changes in foreign exchange rates associated with the forecasted purchase or sale of assets denominated in foreign currencies. As of December 29, 2024, substantially all of our commodity-related cash flow hedges were for transactions forecasted through December 2025.
As of December 29, 2024, the notional volumes associated with open derivative instruments designated in cash flow hedging relationships were as follows:
| Volume | Metric | ||||||||||
| Lean hogs | Pounds | ||||||||||
| Corn | Bushels | ||||||||||
| Soybean meal | Tons | ||||||||||
Natural Gas |
Million BTU | ||||||||||
| Diesel | Gallons | ||||||||||
115
The following table presents the effects on our consolidated financial statements of pre-tax gains and losses on derivative instruments designated in cash flow hedging relationships for the periods indicated:
Gains (Losses) Recognized in Other Comprehensive Income (Loss) on Derivative |
Gains (Losses) Reclassified from Accumulated Other Comprehensive Loss into Earnings | ||||||||||||||||||||||||||||||||||
| Fiscal Year | Fiscal Year | ||||||||||||||||||||||||||||||||||
| 2024 | 2023 | 2022 | 2024 | 2023 | 2022 | ||||||||||||||||||||||||||||||
| (in millions) | (in millions) | ||||||||||||||||||||||||||||||||||
| Commodity contracts | $ | ( |
$ | $ | ( |
||||||||||||||||||||||||||||||
| Interest rate swaps | ( |
( |
( |
||||||||||||||||||||||||||||||||
| Foreign exchange contracts | ( |
||||||||||||||||||||||||||||||||||
| Total | $ | ( |
$ | $ | $ | ( |
$ | $ | |||||||||||||||||||||||||||
In fiscal years 2024 and 2023, we recognized a total of $110 million and $53 million, respectively, in expenses for option premiums, which are excluded from the assessment of hedge effectiveness. As of December 29, 2024 and December 31, 2023, accumulated other comprehensive income included $2 million of net losses and $29 million of net gains, respectively, associated with options for which the underlying hedged transactions had not yet impacted earnings. This amount represents the difference between the change in the fair value of the options and the amount of option premiums amortized through earnings.
We expect to reclassify $5 million ($3 million net of tax) of deferred gains on closed commodity and interest rate contracts into earnings within the next twelve months. We are unable to estimate the amount of deferred gains or losses related to open contracts to be reclassified into earnings within the next twelve months as their values are subject to change.
Fair Value Hedges
We enter into derivative instruments (primarily futures contracts) that are designed to hedge changes in the fair value of firm commitments to buy grains and hogs. As of December 29, 2024, the notional volumes associated with open derivative instruments designated in fair value hedging relationships were as follows:
| Volume | Metric | ||||||||||
| Lean hogs | Pounds | ||||||||||
| Corn | Bushels | ||||||||||
| Soybeans | Bushels | ||||||||||
The carrying values of hedged firm commitments designated in fair value hedge relationships as of December 29, 2024 and December 31, 2023 were not material. When the underlying inventories are acquired, the hedge relationship is discontinued and the fair value hedge adjustment is reclassified to inventories. The amount of fair value hedge gains remaining in inventories for which hedge accounting has been discontinued was $3 million and $7 million as of December 29, 2024 and December 31, 2023, respectively.
116
Mark-to-Market Method
As of December 29, 2024, the notional volumes associated with open derivative instruments using the “mark-to-market” method were as follows:
| Volume | Metric | ||||||||||
| Commodities: | |||||||||||
| Lean hogs | Pounds | ||||||||||
| Corn | Bushels | ||||||||||
| Soybean meal | Tons | ||||||||||
| Soybeans | Bushels | ||||||||||
| Diesel | Gallons | ||||||||||
| Foreign currency | U.S. Dollars | ||||||||||
117
Derivative Impact on the Consolidated Statements of Income
The following table presents the effect of derivatives on the consolidated statements of income for the periods indicated:
Fiscal Year |
|||||||||||||||||
| 2024 | 2023 | 2022 | |||||||||||||||
| (in millions) | |||||||||||||||||
| Sales | |||||||||||||||||
| Cash flow hedging - commodity contracts | $ | $ | $ | ( |
|||||||||||||
| Mark to market - commodity contracts | ( |
( |
|||||||||||||||
| Total derivative gain (loss) recognized sales | ( |
||||||||||||||||
| Cost of Sales | |||||||||||||||||
| Cash flow hedging - commodity contracts | ( |
||||||||||||||||
| Fair value hedging - commodity contracts | |||||||||||||||||
| Change in fair value of open derivatives | ( |
||||||||||||||||
| Change in fair value of related hedged items | ( |
( |
|||||||||||||||
Gain (loss) on closed derivatives (1)
|
( |
||||||||||||||||
| Mark to market - commodity contracts | ( |
( |
|||||||||||||||
| Total derivative gain (loss) recognized in cost of sales | ( |
( |
|||||||||||||||
| Selling, general and administrative expenses | |||||||||||||||||
Mark to market - foreign exchange contracts |
( |
||||||||||||||||
| Interest expense | |||||||||||||||||
| Cash flow hedging - interest rate contracts | ( |
( |
( |
||||||||||||||
Discontinued operations |
|||||||||||||||||
Cash flow hedging - foreign exchange contracts |
( |
||||||||||||||||
Mark to market - foreign exchange contracts |
|||||||||||||||||
Total derivative gain (loss) recognized in discontinued operations |
|||||||||||||||||
| Total derivative gain (loss) | $ | ( |
$ | $ | |||||||||||||
________________
(1)Represents the amount of fair value hedge adjustment applied to the carrying amount of hedged assets that is recognized in cost of sales as the underlying hedged assets are relieved from inventories and charged to cost of sales.
118
NOTE 9: EQUITY METHOD INVESTMENTS
Equity method investments consist of the following:
| Equity Investments | % Owned | December 29, 2024 |
December 31, 2023 |
|||||||||||||||||
| (in millions) | ||||||||||||||||||||
| Align | % | $ | $ | |||||||||||||||||
| Monarch | % | |||||||||||||||||||
| Murphy Family Farms | % | |||||||||||||||||||
| Viceroy | % | |||||||||||||||||||
| All other equity method investments | % | |||||||||||||||||||
| Total investments | $ | $ | ||||||||||||||||||
Align, Monarch and Viceroy Bio Energy, LLC (“Viceroy”) operate renewable natural gas facilities, which refine methane gas that is captured from our Company-owned and contract grower hog farms into renewable natural gas. All significant operating decisions are made jointly between us and our investment partners, and therefore, we do not consolidate these entities.
On January 16, 2025, TPG Rise Climate, one of the other two equal joint venture partners in Monarch, delivered a sale notice under the joint venture agreement, pursuant to which Monarch must pursue a sale of the joint venture. In the event that a sale of Monarch is not consummated before January 17, 2026, TPG Rise Climate may require that Monarch purchase TPG Rise Climate’s ownership interests in Monarch.
Murphy Family Farms and VisionAg Hog Production
On December 27, 2024, we became a member of a North Carolina-based company, Murphy Family Farms and on February 24, 2025, we became a member of a North Carolina-based company, VisionAg. See “Note 6: Restructuring” for more information. We expect to account for Murphy Family Farms and Vision Ag under the equity method of accounting.
119
NOTE 10: ACCRUED EXPENSES AND OTHER CURRENT LIABILITIES
Accrued expenses and other current liabilities consist of the following:
| December 29, 2024 | December 31, 2023 | ||||||||||
| (in millions) | |||||||||||
| Payroll and related benefits | $ | $ | |||||||||
| Litigation contingencies | |||||||||||
| Accrued customer incentives and marketing | |||||||||||
| Accrued insurance | |||||||||||
| Accrued contract grower services | |||||||||||
| Accrued interest | |||||||||||
| Accrued pension and other post-employment benefits | |||||||||||
| Accrued rent | |||||||||||
| Amounts owed to purchasing banks pursuant to the Monetization Facility | |||||||||||
| Derivative instruments and broker deposits | |||||||||||
| Accrued exit and disposal costs | |||||||||||
Payables to related parties (1)
|
|||||||||||
| Other | |||||||||||
| Total accrued expenses and other current liabilities | $ | $ | |||||||||
(1)See “Note 17: Related Party Transactions” for related party transactions.
NOTE 11: DEBT
Long-term debt consists of the following:
| December 29, 2024 |
December 31, 2023 |
||||||||||
| (in millions) | |||||||||||
| $ | $ | ||||||||||
| Bank borrowings | |||||||||||
| Total debt | |||||||||||
| Current portion | ( |
||||||||||
| Total long-term debt | $ | $ | |||||||||
120
Scheduled principal payments on debt for the next five years are as follows:
| Year | (in millions) | |||||||
| 2025 | $ | |||||||
| 2026 | ||||||||
| 2027 | ||||||||
| 2028 | ||||||||
| 2029 | ||||||||
Credit Facilities
| December 29, 2024 | ||||||||||||||||||||||||||||||||||||||
| Facility | Capacity | Borrowing Base Adjustment | Outstanding Borrowings | Commercial Paper Borrowings | Outstanding Letters of Credit | Amount Available | ||||||||||||||||||||||||||||||||
| (in millions) | ||||||||||||||||||||||||||||||||||||||
| Senior unsecured revolving credit facility | $ | $ | $ |
|
$ | $ | $ | |||||||||||||||||||||||||||||||
| Accounts receivable securitization facility |
|
( |
||||||||||||||||||||||||||||||||||||
| Total credit facilities | $ | $ | $ |
|
$ | $ | ( |
$ | ||||||||||||||||||||||||||||||
Senior Unsecured Revolving Credit Facility
In February 2025, we refinanced our $2,100 million senior unsecured revolving credit facility (“Senior Revolving Credit Facility”) extending the maturity date from May 21, 2027 to February 12, 2030, with the option to extend the maturity date for up to two one-year periods, subject to obtaining the lenders’ consent and satisfaction of certain other conditions. The Senior Revolving Credit Facility capacity remains at $2,100 million. As part of the new agreement, there are no longer any Subsidiary Guarantors under the Senior Revolving Credit Facility which also released the Subsidiary Guarantors from our Senior Unsecured Notes. The Senior Revolving Credit Facility bears interest at the Secured Overnight Financing Rate plus a margin ranging from 0.875 % to 1.50 % per annum, or, at our election, at a base rate plus a margin ranging from 0.00 % to 0.50 % per annum, in each case depending on our senior unsecured debt ratings. The Senior Revolving Credit Facility also contains financial maintenance covenants requiring us to maintain a maximum total consolidated leverage ratio (ratio of consolidated funded debt to consolidated capitalization, each as defined in the Senior Revolving Credit Facility) of 0.50 to 1.00 (which we may elect to increase to 0.55 to 1.00 with respect to any fiscal quarter in which a material acquisition is consummated and the immediately following three consecutive fiscal quarters, subject to certain restrictions) and a minimum interest coverage ratio (ratio of earnings before interest, taxes, depreciation and amortization (“EBITDA”) to consolidated interest expense, each as defined in the Senior Revolving Credit Facility) of 3.50 to 1.00.
Our Senior Revolving Credit Facility contains customary covenants, including, but not limited to, restrictions on our ability and that of our subsidiaries to merge and consolidate with other companies, incur indebtedness, grant liens or security interests on assets subject to their security interest, make acquisitions, loans, advances or investments, pay dividends, sell or otherwise transfer assets, optionally prepay or modify terms of any junior indebtedness or enter into transactions with affiliates, each subject to certain exceptions as set forth therein. We are currently in compliance with the covenants under our Senior Revolving Credit Facility.
We have a commercial paper program, which is supported by the Senior Revolving Credit Facility, that provides access to a low-cost source of borrowing to fund general corporate purposes, including working capital. The maximum issuance capacity under our commercial paper program is $1,750 million. The maturity of commercial paper issued under the program varies but does not exceed 397 days from the date of issuance. Our ability to access the commercial paper market in the future is dependent on maintaining investment grade credit ratings and market conditions.
121
Accounts Receivable Securitization Facility
In November 2024, we refinanced our accounts receivable securitization facility (“Securitization Facility”), which extended the maturity date to November 22, 2027, and reduced the borrowing capacity to $225 million. As part of the Securitization Facility, certain accounts receivable of our major domestic meat processing subsidiaries are sold to a wholly owned “bankruptcy remote” special purpose vehicle (“SPV”). The SPV pledges all such accounts receivable not otherwise sold pursuant to the Monetization Facility (as defined below) as security for loans made, and letters of credit issued, by participating lenders under the Securitization Facility. The SPV is included in our consolidated financial statements and therefore the accounts receivable owned by it are included in our consolidated balance sheets. However, the accounts receivable owned by the SPV are separate and distinct from our other assets and are not available to our other creditors should we become insolvent. As of December 29, 2024, the SPV held $374 million of accounts receivable. We must maintain certain ratios related to the collection of our receivables as a condition of the Securitization Facility agreement. As of December 29, 2024, we had $22 million in letters of credit issued under the Securitization Facility. None of the letters of credit were drawn upon.
Under the Securitization Facility, we and the SPV, as applicable, are subject to certain customary covenants, including, but not limited to, restrictions on our ability to sell, assign or otherwise dispose of any collateral or assign any right to receive income with respect thereto, use proceeds for any purpose other than those set forth in the Securitization Facility, make certain payments on junior indebtedness, incur debt or merge or consolidate, subject to certain exceptions set forth therein. The SPV is also prohibited from issuing any LCR Security (as defined in the Securitization Facility agreement). We are currently in compliance with the covenants under the Securitization Facility.
Monetization Facility
In addition to the Securitization Facility, we maintain an uncommitted $250 million accounts receivable monetization facility (“Monetization Facility”). At Smithfield’s election and subject to the purchasing banks’ approval, certain accounts receivable may be sold by the SPV to purchasing banks, so long as the uncollected outstanding amount of accounts receivable sold pursuant to the Monetization Facility does not exceed $250 million in the aggregate at any time, among other limitations. In the event of a sale, the purchasing banks assume all credit risk related to the receivables while we maintain risk associated with customer disputes. We account for the sale of receivables to a purchasing bank by derecognizing the receivables from our consolidated balance sheet upon transfer of control to the purchasing bank, and recognizing a discount on the sale in SG&A in the consolidated statement of income. The proceeds from the sale of receivables are included in net cash flows from operating activities in the consolidated statement of cash flows. On behalf of the purchasing banks, we continue to service all receivables sold under the Monetization Facility. As of December 29, 2024, the uncollected balance of receivables that had been sold to purchasing banks was $230 million. We had no servicing asset or liability outstanding as of December 29, 2024.
In the first quarter of fiscal year 2023, we sold $227 million of accounts receivable at a discount and received proceeds totaling $225 million. Subsequently, we reinvested $4,094 million and $3,431 million of cash collections from customers in the revolving sale of accounts receivable to purchasing banks in fiscal years 2024 and 2023, respectively. We recognized charges totaling $15 million and $12 million in fiscal years 2024 and 2023, respectively, attributable to the discount on the sale of accounts receivable in SG&A in the consolidated statement of income.
NOTE 12: LEASE OBLIGATIONS, COMMITMENTS, AND GUARANTEES
We lease real estate, vehicles, machinery and other equipment. Additionally, we have contracts with independent farmers to raise our hogs that include a lease component for the use of the farmers’ facilities. Our leases may include options to extend or terminate the lease, variable lease payments based on usage of the underlying assets and residual value guarantees.
122
The following table presents the maturities of our lease obligations as of December 29, 2024:
| Operating Leases | Finance Leases | Total | |||||||||||||||
| (in millions) | |||||||||||||||||
| 2025 | $ | $ | $ | ||||||||||||||
| 2026 | |||||||||||||||||
| 2027 | |||||||||||||||||
| 2028 | |||||||||||||||||
| 2029 | |||||||||||||||||
| After 2029 | |||||||||||||||||
| Total lease payments | $ | $ | $ | ||||||||||||||
| Present value discount | ( |
( |
|||||||||||||||
| Present value of lease obligations | $ | $ | $ | ||||||||||||||
The following table presents the weighted-average lease term and discount rate for our finance and operating leases:
| December 29, 2024 |
December 31, 2023 |
||||||||||
| Weighted-average remaining lease term (years): | |||||||||||
| Finance leases | |||||||||||
| Operating leases | |||||||||||
| Weighted-average discount rate: | |||||||||||
| Finance leases | % | % | |||||||||
| Operating leases | % | % | |||||||||
The components of total lease cost included in the consolidated statements of income are presented in the following table:
| Fiscal Year | |||||||||||||||||
| 2024 | 2023 | 2022 | |||||||||||||||
| (in millions) | |||||||||||||||||
| Operating lease cost | $ | $ | $ | ||||||||||||||
| Finance lease cost: | |||||||||||||||||
| Amortization of leased assets | |||||||||||||||||
| Interest on lease obligations | |||||||||||||||||
Short-term lease cost (1)
|
|||||||||||||||||
Variable lease cost (2)
|
|||||||||||||||||
| Total lease cost | $ | $ | $ | ||||||||||||||
________________
(1)Represents the expense for leases with terms of one year or less, which are not included in the lease obligation.
(2)Represents the expense associated with lease payments that vary based on usage or changes in other circumstances, which are not included in the lease obligation.
123
The following table presents the classification of lease payments associated with our lease obligations in the statements of cash flows, as well as new, or modifications to existing, lease obligations entered into during the periods presented:
| Fiscal Year | |||||||||||||||||
| 2024 | 2023 | 2022 | |||||||||||||||
| (in millions) | |||||||||||||||||
| Classification of lease payments: | |||||||||||||||||
Operating cash flows - finance leases (1)
|
$ | $ | $ | ||||||||||||||
| Operating cash flows - operating leases | |||||||||||||||||
| Financing cash flows - finance leases | |||||||||||||||||
| New, or modifications to existing, finance lease obligations | |||||||||||||||||
| New, or modifications to existing, operating lease obligations | |||||||||||||||||
________________
Commitments
We have purchase commitments with certain livestock producers that obligate us to purchase all the livestock that these producers deliver. Other arrangements obligate us to purchase a fixed amount of livestock. We have purchase commitments under forward grain contracts that obligate us to purchase a fixed amount of grain. We also have contractual commitments to independent farmers who raise our hogs in exchange for a performance-based service fee payable upon delivery. We estimate the future obligations under these commitments based on the amounts that are fixed and determinable in the related contracts. There are additional variable components of these contracts not included in our estimates that are based on quantities delivered and performance. Our estimated future obligations under these and other commitments are as follows:
| Year | (in millions) | |||||||
| 2025 | $ | |||||||
| 2026 | ||||||||
| 2027 | ||||||||
| 2028 | ||||||||
| 2029 | ||||||||
All minimum purchase commitments under these contracts were fulfilled in each of fiscal years 2024, 2023 and 2022.
In 2019, we announced that we planned to contribute up to $250 million to Align through 2028 to fund various projects as approved by Align’s board from time to time. As of December 29, 2024, we had contributed $114 million in capital toward these planned contributions. Should the board, of which we have 50 % of the voting power, choose not to approve additional projects, the remaining contributions would not be required.
We have committed to contribute up to $25 million to the TPG Rise Climate investment fund through July 2027. As of December 29, 2024, we had contributed $17 million in capital toward this commitment.
We had $73 million of committed funds related to approved capital expenditure projects as of December 29, 2024. These projects are expected to be funded with cash flows from operations and/or borrowings under credit facilities.
Guarantees
Smithfield and certain other joint venture partners in Monarch joint and severally guarantee Monarch’s debt, interest and fees. As of December 29, 2024, the maximum amount of loans that could be outstanding under Monarch’s debt agreements was $61 million and the loans mature in June 2025. Monarch’s outstanding debt was $43 million as of the end of fiscal year 2024.
124
NOTE 13: INCOME TAXES
Income (loss) from continuing operations before income taxes consists of the following:
| Fiscal Year | |||||||||||||||||
| 2024 | 2023 | 2022 | |||||||||||||||
| (in millions) | |||||||||||||||||
U.S. |
$ | $ | ( |
$ | |||||||||||||
| Foreign | ( |
||||||||||||||||
Total income (loss) from continuing operations before income taxes |
$ | $ | ( |
$ | |||||||||||||
Income Tax Expense
Income tax expense (benefit) from continuing operations consists of the following:
| Fiscal Year | |||||||||||||||||
| 2024 | 2023 | 2022 | |||||||||||||||
| (in millions) | |||||||||||||||||
| Current income tax expense: | |||||||||||||||||
| Federal | $ | $ | $ | ||||||||||||||
| State | |||||||||||||||||
| Foreign | |||||||||||||||||
| Deferred income tax expense (benefit): | |||||||||||||||||
| Federal | ( |
( |
|||||||||||||||
| State | ( |
||||||||||||||||
| Foreign | ( |
||||||||||||||||
| ( |
|||||||||||||||||
| Total income tax expense (benefit) | $ | $ | ( |
$ | |||||||||||||
125
Effective Tax Rate Reconciliation
The following table reconciles the federal statutory income tax rate to our effective tax rate:
| Fiscal Year | |||||||||||||||||
| 2024 | 2023 | 2022 | |||||||||||||||
| Federal income taxes at statutory rate | % | % | % | ||||||||||||||
Uncertain tax positions |
( |
||||||||||||||||
| State income taxes, net of federal tax benefit | ( |
||||||||||||||||
| Impact of foreign operations | ( |
||||||||||||||||
Equity method investments (1)
|
( |
||||||||||||||||
Officers’ life insurance |
( |
||||||||||||||||
| Foreign income taxes | ( |
||||||||||||||||
Tax credits (2)
|
( |
( |
|||||||||||||||
| Other | |||||||||||||||||
| Effective tax rate | % | % | % | ||||||||||||||
________________
(1)The results of our equity method investments are excluded from income (loss) from continuing operations before income taxes. However, to the extent applicable, income taxes on our equity method investments are included in income tax expense (benefit), which can have significant impact on our computed effective tax rate.
(2)We recognized federal tax credits of $14 million, $17 million and $13 million in fiscal years 2024, 2023 and 2022, respectively.
The impact of the reconciling items between the federal statutory rate and our effective tax rate were more pronounced in fiscal year 2023 largely due to the pre-tax loss of $129 million in fiscal year 2023 compared to pre-tax income of $1,061 million and $1,047 million in fiscal years 2024 and 2022, respectively.
Income Taxes Receivable and Payable
Income taxes receivable totaled $99 million and $27 million as of December 29, 2024 and December 31, 2023, respectively, and were included in prepaid expenses and other current assets on the consolidated balance sheets. Income taxes payable totaled $9 million as of December 29, 2024 and was included in accrued expenses and other current liabilities on the consolidated balance sheet. We had long-term income taxes receivable of $13 million as of December 31, 2023 included in other assets on the consolidated balance sheet.
126
Deferred Tax Assets and Liabilities
The tax effects of temporary differences between the tax basis and book basis of our assets and liabilities are presented in the table below:
| December 29, 2024 |
December 31, 2023 |
||||||||||
| (in millions) | |||||||||||
| Deferred tax assets: | |||||||||||
| Research and development expenses | $ | $ | |||||||||
| Operating lease obligations | |||||||||||
| Pension and other retirement liabilities | |||||||||||
| Accrued expenses and other current liabilities | |||||||||||
Tax credits, carryforwards and net operating losses (1)
|
|||||||||||
| Employee benefits | |||||||||||
| Deferred payroll taxes | |||||||||||
| Other | |||||||||||
| Total deferred tax asset before valuation allowance | |||||||||||
Valuation allowance (2)
|
( |
( |
|||||||||
| Total deferred tax asset | $ | $ | |||||||||
| Deferred tax liabilities: | |||||||||||
| Property, plant and equipment | |||||||||||
| Intangible assets | |||||||||||
| Operating lease assets | |||||||||||
| Inventory | |||||||||||
| Investments | |||||||||||
| Other | |||||||||||
| Total deferred tax liability | $ | $ | |||||||||
| Net deferred tax liability | $ | $ | |||||||||
________________
(1)We have $3 million of gross foreign net operating losses that will expire between 2030 and 2032. We have $643 million of gross state net operating losses, $37 million of which have no expiration, and $606 million that will expire between 2025 and 2043. We have $3 million of state tax credits that will expire between 2025 and 2038.
127
Unrecognized Tax Benefits
A reconciliation of the beginning and ending liability, excluding interest and penalties, for unrecognized tax benefits is as follows:
| (in millions) | |||||
| Balance, January 2, 2022 | $ | ||||
| Additions for tax positions taken in fiscal year 2022 | |||||
| Lapse of statute of limitations | ( |
||||
| Balance, January 1, 2023 | |||||
| Additions for tax positions taken in fiscal year 2023 | |||||
| Additions for tax positions taken for prior years | |||||
| Lapse of statute of limitations | ( |
||||
| Balance, December 31, 2023 | |||||
| Additions for tax positions taken in fiscal year 2024 | |||||
| Additions for tax positions taken for prior years | |||||
| Reductions for cash remittances for tax positions taken in prior years | ( |
||||
| Lapse of statute of limitations | ( |
||||
| Balance, December 29, 2024 | $ | ||||
During fiscal years 2024, 2023 and 2022, we recognized interest and penalties of $2 million, $4 million, and $(2 ) million, respectively, within income tax expense (benefit). The unrecognized tax benefits, if recognized, would favorably affect income tax expense by $29 million, $25 million, and $13 million in fiscal years 2024, 2023 and 2022, respectively. It is not practicable at this time to estimate the amount of unrecognized tax benefits that will change in the next twelve months.
We operate in multiple taxing jurisdictions, both within the U.S. and outside of the U.S., and are subject to examination from various tax authorities. The liability for unrecognized tax benefits included $11 million and $9 million of accrued interest as of December 29, 2024 and December 31, 2023, respectively.
We are currently being audited in several tax jurisdictions and remain subject to examination until the statute of limitations expires for the respective tax jurisdiction. Within the U.S. and Mexico, we may be subject to audit by various tax authorities, and our subsidiaries operating within each country may be subject to different statute of limitations expiration dates. We have concluded all U.S. federal income tax matters through the tax year ended January 1, 2017. We are currently under U.S federal examination for all subsequent tax years through December 29, 2024. We are also subject to examination from tax authorities in Mexico and certain U.S. states for the tax years ended January 3, 2021 through December 29, 2024.
We consider the earnings of our foreign subsidiaries to be indefinitely reinvested as we intend to use these earnings in our foreign operations. The amount of foreign subsidiary net earnings that was considered indefinitely reinvested was $164 million and $141 million as of December 29, 2024 and December 31, 2023, respectively, which is considered previously taxed income. The determination of any unrecorded deferred tax asset or liability on the remaining excess carrying amount of our investments over their respective tax bases is not practicable due to the uncertainty of how these investments would be recovered and such differences are not expected to be recognized in the foreseeable future.
NOTE 14: PENSION AND OTHER RETIREMENT PLANS
Company Sponsored Defined Benefit Pension Plans
We have several qualified and non-qualified defined benefit pension plans. Benefits under the qualified plans were frozen in 2021 for all non-union participants.
128
The following table presents a reconciliation of the pension benefit obligation, plan assets and the funded status of our pension plans:
| December 29, 2024 |
December 31, 2023 |
||||||||||
| (in millions) | |||||||||||
| Change in benefit obligation: | |||||||||||
| Benefit obligation at beginning of year | $ | $ | |||||||||
| Service cost | |||||||||||
| Interest cost | |||||||||||
| Benefits paid | ( |
( |
|||||||||
| Actuarial (gain) loss | ( |
||||||||||
| Benefit obligation at end of year | |||||||||||
Change in plan assets: (1)
|
|||||||||||
| Fair value of plan assets at beginning of year | |||||||||||
| Actual return on plan assets | |||||||||||
| Employer contributions | |||||||||||
| Benefits paid | ( |
( |
|||||||||
| Fair value of plan assets at end of year | |||||||||||
| Funded status | $ | $ | |||||||||
| Amounts recognized in the consolidated balance sheets: | |||||||||||
| Net long-term pension liability | |||||||||||
| Accrued expenses and other current liabilities | |||||||||||
| Net amount recognized at end of year | $ | $ | |||||||||
________________
The accumulated benefit obligation for all defined benefit pension plans was $1,774 million and $1,803 million as of December 29, 2024 and December 31, 2023, respectively. The accumulated benefit obligation exceeded plan assets for all defined benefit plans as of December 29, 2024 and December 31, 2023, respectively.
The following table presents the pre-tax unrecognized items included as components of accumulated other comprehensive loss related to our defined benefit pension plans as of the dates indicated:
| December 29, 2024 |
December 31, 2023 |
||||||||||
| (in millions) | |||||||||||
| Unrecognized actuarial loss | $ | ( |
$ | ( |
|||||||
| Unrecognized prior service cost | ( |
( |
|||||||||
129
The following table presents the components of the net periodic pension cost (benefit) for the periods indicated:
| Fiscal Year | |||||||||||||||||
| 2024 | 2023 | 2022 | |||||||||||||||
| (in millions) | |||||||||||||||||
| Service cost | $ | $ | $ | ||||||||||||||
| Interest cost | |||||||||||||||||
| Expected return on plan assets | ( |
( |
( |
||||||||||||||
| Amortization | |||||||||||||||||
| Net periodic pension cost (benefit) | $ | $ | $ | ( |
|||||||||||||
The following table shows our weighted average assumptions for the periods indicated:
| Fiscal Year | |||||||||||||||||
| 2024 | 2023 | 2022 | |||||||||||||||
| Discount rate to determine net periodic pension cost (benefit) | % | % | % | ||||||||||||||
| Discount rate to determine benefit obligation | |||||||||||||||||
| Expected long-term rate of return on plan assets | |||||||||||||||||
| Rate of compensation increase | |||||||||||||||||
We use a third-party actuary to assist in the determination of assumptions used and the measurement of our pension obligation and related costs. We review and select the discount rate to be used in connection with our pension obligation annually. In determining the discount rate, a hypothetical bond portfolio is constructed based on bonds (with an AA rating or better) whose cash flows from coupons and maturities match the year-by-year projected benefit payments from defined benefit pension plans. We use the resulting yield of this portfolio to determine the discount rate applicable to our obligation. A similar methodology is used to develop the discount rate applicable to service cost.
To determine the expected long-term return on plan assets, we consider the current and anticipated asset allocations, as well as historical and estimated returns on various categories of plan assets. Long-term trends are evaluated relative to market factors such as inflation, interest rates and fiscal and monetary policies in order to assess the capital market assumptions. Actual results that differ from our assumptions are recorded in accumulated other comprehensive loss and amortized over future periods and, therefore, affect expense in future periods.
Pension plan assets may be invested in cash and cash equivalents, equities, commingled funds, debt securities and alternative investments. Our investment policy for the pension plans is to balance risk and return through a diversified portfolio of high-quality equity and fixed income securities. Maturity for fixed income securities is managed such that sufficient liquidity exists to meet near-term benefit payment obligations. The plans retain outside investment advisors to manage plan investments within parameters established by our plan trustees.
The following table presents the fair value of our qualified pension plan assets by major asset category. The allocation of our pension plan assets is based on the target range presented in the following table.
| Asset category: | December 29, 2024 |
December 31, 2023 |
Target Range | |||||||||||||||||
| (in millions) | ||||||||||||||||||||
| Cash and cash equivalents, net of unsettled transactions | $ | $ | ||||||||||||||||||
| Equity securities | ||||||||||||||||||||
| Debt securities | ||||||||||||||||||||
| Alternative assets | ||||||||||||||||||||
| Total plan assets | $ | $ | ||||||||||||||||||
130
See “Note 16: Fair Value Measurements” for additional information about the fair value of our pension assets.
The funding requirement for our qualified pension plans in fiscal year 2025 is expected to be $6 million. We also expect to contribute $23 million to our non-qualified pension plans to cover expected benefit payments.
Expected future benefit payments for our defined benefit pension plans are as follows:
| Fiscal Year | (in millions) | |||||||
| 2025 | $ | |||||||
| 2026 | ||||||||
| 2027 | ||||||||
| 2028 | ||||||||
| 2029 | ||||||||
| 2030 - 2034 | ||||||||
Multiemployer Defined Benefit Pension Plans
In addition to our Company sponsored defined benefit pension plans, we contribute to several multiemployer defined benefit pension plans under collective bargaining agreements that cover certain of our union-represented employees. The risks of participating in such plans are different from the risks of single-employer plans, in the following respects:
•Assets contributed to a multiemployer plan by one employer may be used to provide benefits to employees of other participating employers.
•If a participating employer ceases to contribute to a multiemployer plan, the unfunded obligation of the plan may be borne by the remaining participating employers.
•If we were to withdraw from a multiemployer plan, we may be required to pay the plan an amount based on the underfunded status of the plan and on the history of our participation in the plan prior to withdrawal. This is referred to as a withdrawal liability.
Each multiemployer plan in which we participate has a certified zone status as currently defined by the Pension Protection Act of 2006. The zone status is based on information provided by each plan and is certified by the plan's actuary. The following are descriptions of the zone status types based on criteria established under the Internal Revenue Code (“IRC”):
•“Red” Zone—Plan has been determined to be in “critical status” and is generally less than 65% funded. A rehabilitation plan, as required under the IRC, must be adopted by plans in the “red” zone. Plan participants may be responsible for the payment of surcharges, in addition to the contribution rate specified in the applicable collective bargaining agreement, for a plan in “critical status,” in accordance with the requirements of the IRC.
•“Yellow” Zone—Plan has been determined to be in “endangered status” and is generally less than 80% funded. A funding improvement plan, as required under the IRC, must be adopted.
•“Green” Zone—Plan has been determined to be neither in “critical status” nor in “endangered status,” and is generally at least 80% funded.
The IAM National Pension Fund National Pension Plan was in the “red” zone, and all other plans in which we participate were in the “green” zone for the two most recent benefit plan years that have been certified.
The following table summarizes information about the multiemployer plans in which we participate, including our contributions to the plans. Our contributions to these plans did not exceed 5% of total plan contributions for any plan year presented.
131
| Fiscal Years | ||||||||||||||||||||||||||||||||
| Plan |
EIN / PN (1)
|
2024 | 2023 | 2022 | Expiration Dates of Collective Bargaining Agreements | |||||||||||||||||||||||||||
| (in millions) | ||||||||||||||||||||||||||||||||
| United Food and Commercial Workers International Union Industry Pension Fund | 51-6055922 / 001 | $ | $ | $ |
Multiple (2)
|
|||||||||||||||||||||||||||
| Central Pension Fund of the International Union of Operating Engineers and Participating Employers | 36-6052390 / 001 | October 2028 |
||||||||||||||||||||||||||||||
| IAM National Pension Fund National Pension Plan | 51-6031295 / 002 | February 2026 |
||||||||||||||||||||||||||||||
| Total contributions to multiemployer plans | $ | $ | $ | |||||||||||||||||||||||||||||
________________
(1)Represents the Employer Identification Number and the three-digit plan number assigned to a plan by the Internal Revenue Service.
(2)We have multiple collective bargaining agreements associated with the United Food and Commercial Workers International Union Industry Pension Fund. These agreements are currently scheduled to expire between January 2026 and May 2028.
Other Post-Employment Benefit Plans
We sponsor defined contribution plans (401(k) plans) covering substantially all U.S. employees. The amount of employee contributions we match varies depending on the plan or other factors, but is based primarily on each participant’s level of contribution and cannot exceed the maximum allowable for tax purposes. Total Company contributions were $68 million, $67 million, and $68 million, in fiscal years 2024, 2023 and 2022, respectively.
We also provide health care and life insurance benefits for certain retired employees. These plans are unfunded and generally pay covered costs reduced by retiree premium contributions, co-payments and deductibles. We retain the right to modify or eliminate these benefits. We consider disclosures related to these plans immaterial to the consolidated financial statements.
NOTE 15: EQUITY
Stock Split and Initial Public Offering
On January 17, 2025, the Company’s board of directors and shareholder approved a 380,069.232 -for-one stock split of its issued and outstanding shares of common stock, resulting in issued and outstanding shares of common stock of 380,069,232 5,000,000,000 , the par value of which was not adjusted, and 100,000,000 shares of preferred stock were authorized. All share and per share amounts for all periods presented in the accompanying financial statements have been adjusted retroactively to reflect this stock split.
On January 29, 2025, we completed our initial public offering (“IPO”) of 26,086,958 shares of common stock, which represents 7 % of the total outstanding shares, at a price of $20.00 per share. We issued 13,043,479 shares of common stock bringing the total number of outstanding shares to 393,112,711 . The remaining 13,043,479 shares of common stock were sold by our existing shareholder. Our existing shareholder granted the underwriters a 30-day option to purchase up to 3,913,042 additional shares of our common stock. On February 20, 2025, the underwriters partially exercised such option and purchased 2,506,936 additional shares of common stock from our existing shareholder. We received net proceeds from the IPO of approximately $236 million after deducting underwriting discounts, commissions and fees.
In connection with the IPO, we granted to our directors and certain of our employees and certain directors and employees of WH Group:
•options to purchase 9,822,467 shares with an exercise price equal to the IPO price and an aggregate grant date fair value of $30 million; and
132
•1,527,000 restricted stock units (“RSUs”) with an aggregate grant date fair value of $31 million.
Both the options and RSUs vest over a five year period, with 20
Accumulated Other Comprehensive Loss
Accumulated other comprehensive loss consists of the following (net of tax):
| Fiscal Year | |||||||||||||||||
| 2024 | 2023 | 2022 | |||||||||||||||
| (in millions) | |||||||||||||||||
| Foreign currency translation | $ | ( |
$ | ( |
$ | ( |
|||||||||||
| Pension accounting | ( |
( |
( |
||||||||||||||
| Hedge accounting | ( |
||||||||||||||||
| Accumulated other comprehensive loss | $ | ( |
$ | ( |
$ | ( |
|||||||||||
133
Other Comprehensive Income (Loss)
The following table presents the details of other comprehensive income (loss).
| Fiscal Year | |||||||||||||||||||||||||||||||||||||||||||||||||||||
| 2024 | 2023 | 2022 | |||||||||||||||||||||||||||||||||||||||||||||||||||
| Before Tax | Tax | After Tax | Before Tax | Tax | After Tax | Before Tax | Tax | After Tax | |||||||||||||||||||||||||||||||||||||||||||||
| (in millions) | |||||||||||||||||||||||||||||||||||||||||||||||||||||
| Continuing operations: | |||||||||||||||||||||||||||||||||||||||||||||||||||||
| Foreign currency translation: | |||||||||||||||||||||||||||||||||||||||||||||||||||||
Translation gains (losses) (1)
|
$ | ( |
$ | $ | ( |
$ | $ | $ | $ | $ | $ | ||||||||||||||||||||||||||||||||||||||||||
Translation losses reclassified to non-operating gains |
|||||||||||||||||||||||||||||||||||||||||||||||||||||
| Retirement benefits: | |||||||||||||||||||||||||||||||||||||||||||||||||||||
| Actuarial gains (losses) | ( |
( |
( |
||||||||||||||||||||||||||||||||||||||||||||||||||
Amortization of actuarial losses and prior service credits reclassified to non-operating gains |
( |
( |
( |
||||||||||||||||||||||||||||||||||||||||||||||||||
| Derivatives: | |||||||||||||||||||||||||||||||||||||||||||||||||||||
| Gains (losses) arising during the period | ( |
( |
( |
( |
|||||||||||||||||||||||||||||||||||||||||||||||||
| (Gains) losses reclassified to sales | ( |
( |
( |
( |
( |
||||||||||||||||||||||||||||||||||||||||||||||||
| (Gains) losses reclassified to cost of sales | ( |
( |
( |
||||||||||||||||||||||||||||||||||||||||||||||||||
| Losses reclassified to interest expense | |||||||||||||||||||||||||||||||||||||||||||||||||||||
| Total other comprehensive income (loss) from continuing operations | $ | ( |
$ | $ | ( |
$ | $ | ( |
$ | $ | $ | ( |
$ | ||||||||||||||||||||||||||||||||||||||||
| Discontinued operations: | |||||||||||||||||||||||||||||||||||||||||||||||||||||
| Foreign currency translation: | |||||||||||||||||||||||||||||||||||||||||||||||||||||
Translation gains (losses) (1)
|
( |
( |
( |
||||||||||||||||||||||||||||||||||||||||||||||||||
| Retirement benefits: | |||||||||||||||||||||||||||||||||||||||||||||||||||||
Amortization of actuarial losses and prior service (credits) reclassified to non-operating gains |
( |
( |
|||||||||||||||||||||||||||||||||||||||||||||||||||
| Derivatives: | |||||||||||||||||||||||||||||||||||||||||||||||||||||
| Derivative gains arising during the period | |||||||||||||||||||||||||||||||||||||||||||||||||||||
| Derivative (gains) losses reclassified to sales | ( |
( |
( |
( |
|||||||||||||||||||||||||||||||||||||||||||||||||
| Total other comprehensive income (loss) from discontinued operations | $ | $ | $ | $ | $ | $ | $ | ( |
$ | ( |
$ | ( |
|||||||||||||||||||||||||||||||||||||||||
Total other comprehensive income (loss) |
$ | ( |
$ | $ | ( |
$ | $ | ( |
$ | $ | ( |
$ | ( |
$ | ( |
||||||||||||||||||||||||||||||||||||||
| Other comprehensive income (loss) attributable to noncontrolling interest | ( |
( |
|||||||||||||||||||||||||||||||||||||||||||||||||||
| Other comprehensive income (loss) attributable to Smithfield | $ | ( |
$ | $ | ( |
$ | $ | ( |
$ | $ | ( |
$ | ( |
$ | ( |
||||||||||||||||||||||||||||||||||||||
________________
NOTE 16: FAIR VALUE MEASUREMENTS
Fair value is defined as the price that would be received to sell an asset or paid to transfer a liability in an orderly transaction between market participants at the measurement date. We are required to consider and reflect the assumptions of market participants in fair value calculations. These factors include nonperformance risk (the risk
134
that an obligation will not be fulfilled) and credit risk, both of the reporting entity (for liabilities) and of the counterparty (for assets).
We use, as appropriate, a market approach (generally, data from market transactions), an income approach (generally, present value techniques), and/or a cost approach (generally, replacement cost) to measure the fair value of an asset or liability. These valuation approaches incorporate inputs, such as observable, independent market data, that we believe are predicated on the assumptions market participants would use to price an asset or liability. These inputs may incorporate, as applicable, certain risks such as nonperformance risk, which includes credit risk.
The FASB has established a three-level fair value hierarchy that prioritizes the inputs used to measure fair value. The fair value hierarchy gives the highest priority to quoted market prices (Level 1) and the lowest priority to unobservable inputs (Level 3). The three levels of inputs used to measure fair value are as follows:
•Level 1—Quoted prices in active markets for identical assets or liabilities accessible by the reporting entity.
•Level 2—Observable inputs other than quoted prices included in Level 1, such as quoted prices for similar assets and liabilities in active markets; quoted prices for identical or similar assets and liabilities in markets that are not active; or other inputs that are observable or can be corroborated by observable market data.
•Level 3—Unobservable for an asset or liability. Unobservable inputs should only be used to the extent observable inputs are not available.
We have classified assets and liabilities measured at fair value based on the lowest level of input that is significant to the fair value measurement. For the periods presented, we had no transfers of assets or liabilities between levels within the fair value hierarchy. The timing of any such transfers would be determined at the end of each reporting period.
Assets and Liabilities Measured at Fair Value on a Recurring Basis
The following tables set forth, by level within the fair value hierarchy, our financial assets and liabilities, including assets held in a rabbi trust used to fund our non-qualified defined benefit plan, that were measured at fair value on a recurring basis:
| December 29, 2024 | December 31, 2023 | |||||||||||||||||||||||||||||||||||||||||||||||||
| Level 1 | Level 2 | Level 3 | Total | Level 1 | Level 2 | Level 3 | Total | |||||||||||||||||||||||||||||||||||||||||||
| (in millions) | ||||||||||||||||||||||||||||||||||||||||||||||||||
| Assets | ||||||||||||||||||||||||||||||||||||||||||||||||||
| Derivatives: | ||||||||||||||||||||||||||||||||||||||||||||||||||
| Commodity contracts | $ | $ | $ | $ | $ | $ | $ | $ | ||||||||||||||||||||||||||||||||||||||||||
| Foreign exchange contracts | ||||||||||||||||||||||||||||||||||||||||||||||||||
Mutual funds (1)
|
||||||||||||||||||||||||||||||||||||||||||||||||||
| Insurance contracts | ||||||||||||||||||||||||||||||||||||||||||||||||||
| Total | $ | $ | $ | $ | $ | $ | $ | $ | ||||||||||||||||||||||||||||||||||||||||||
| Liabilities | ||||||||||||||||||||||||||||||||||||||||||||||||||
| Derivatives: | ||||||||||||||||||||||||||||||||||||||||||||||||||
| Commodity contracts | ||||||||||||||||||||||||||||||||||||||||||||||||||
| Total | $ | $ | $ | $ | $ | $ | $ | $ | ||||||||||||||||||||||||||||||||||||||||||
__________________
(1)Institutional funds that are not publicly traded are estimated at fair value using the net asset value (“NAV”) per share of the investment as a practical expedient and are not categorized in the fair value hierarchy. Therefore, the sum of the values categorized in the fair value hierarchy above do not agree to the total.
135
The following are descriptions of the valuation methodologies and key inputs used to measure financial assets and liabilities recorded at fair value on a recurring basis:
•Derivatives—Derivatives classified within Level 1 are valued using quoted market prices. In some cases where quoted market prices are not available, we value the derivatives using market-based pricing models that utilize the net present value of estimated future cash flows to calculate fair value, in which case the measurements are classified within Level 2. These valuation models make use of market-based observable inputs, including exchange traded prices and rates, yield curves, credit curves and measures of volatility. Level 3 derivatives are valued based on diesel fuel prices and use both observable and unobservable inputs. There is a lack of price transparency with respect to forward prices for diesel fuel. Such unobservable inputs are significant to the diesel fuel derivative contract valuation methodology.
•Mutual funds—Mutual funds consist of publicly traded funds and other institutional funds that are not publicly traded. Publicly traded mutual funds are measured at fair value using quoted market prices and are categorized in Level 1 within the fair value hierarchy.
•Insurance contracts—Insurance contracts are valued at their cash surrender value using the daily asset unit value which is based on the quoted market price of the underlying securities and classified within Level 2.
Assets and Liabilities Measured at Fair Value on a Nonrecurring Basis
Certain assets and liabilities are measured at fair value on a nonrecurring basis after initial recognition; that is, the assets and liabilities are not measured at fair value on an ongoing basis but are subject to fair value adjustments in certain circumstances, for example, when there is evidence of impairment. As of December 29, 2024, we had no significant assets or liabilities that were measured and recorded at fair value on a nonrecurring basis after initial recognition.
We recorded charges of $1 million, $1 million and $40 million in fiscal years 2024, 2023 and 2022, respectively, to write down certain assets to their estimated fair values. Fair value was estimated using a variety of fair value techniques, including an income approach and a market approach based on the relevant information available, which consisted of level 3 inputs. The charges for fiscal years 2024 and 2023 were recorded in cost of sales in the consolidated statements of income. The charge for fiscal year 2022 was recorded in non-operating gains and represents the impairment of our investment in Norson. The fair value of these assets at the time of remeasurement was not material.
Redeemable Noncontrolling Interest
The redemption value for the noncontrolling interest in Altosano is fair value. We estimate the redemption value of Altosano using an income and a market approach. Under the income approach, fair value is determined by using the projected discounted cash flows. Under the market approach, the fair value is determined by reference to guideline companies that are reasonably comparable; the fair value is estimated based on the valuation multiples of EBITDA. The significant unobservable inputs used in the determination of the fair value have an inherent measurement uncertainty that if changed could result in higher or lower fair value measurements as of the reporting date. The following table provides the significant unobservable level 3 inputs used in the valuation:
| Unobservable Inputs | December 29, 2024 | December 31, 2023 |
|||||||||
| Weighted average cost of capital | % | % | |||||||||
| Growth rate | % | % | |||||||||
| EBITDA multiple | |||||||||||
| Control premium | % | % | |||||||||
136
Pension Plan Assets
The following table summarizes our qualified pension plan assets measured at fair value on a recurring basis (at least annually):
| December 29, 2024 | December 31, 2023 | ||||||||||||||||||||||||||||||||||||||||||||||
| Level 1 | Level 2 | Level 3 | Total | Level 1 | Level 2 | Level 3 | Total | ||||||||||||||||||||||||||||||||||||||||
| (in millions) | |||||||||||||||||||||||||||||||||||||||||||||||
| Cash and cash equivalents | $ | $ | $ | $ | $ | $ | $ | $ | |||||||||||||||||||||||||||||||||||||||
| Equity securities: | |||||||||||||||||||||||||||||||||||||||||||||||
| U.S. common stock: | |||||||||||||||||||||||||||||||||||||||||||||||
| Health care | |||||||||||||||||||||||||||||||||||||||||||||||
| Financial services | ( |
||||||||||||||||||||||||||||||||||||||||||||||
| Retail and consumer products | |||||||||||||||||||||||||||||||||||||||||||||||
| Energy | |||||||||||||||||||||||||||||||||||||||||||||||
| Information technology | |||||||||||||||||||||||||||||||||||||||||||||||
| Manufacturing and industrials | |||||||||||||||||||||||||||||||||||||||||||||||
| Telecommunications | |||||||||||||||||||||||||||||||||||||||||||||||
| International common stock | |||||||||||||||||||||||||||||||||||||||||||||||
Commingled funds: (1)
|
|||||||||||||||||||||||||||||||||||||||||||||||
| Global equity | — | — | — | — | — | — | |||||||||||||||||||||||||||||||||||||||||
| Corporate debt securities | — | — | — | — | — | — | |||||||||||||||||||||||||||||||||||||||||
| Fixed income: | |||||||||||||||||||||||||||||||||||||||||||||||
| Corporate debt securities | |||||||||||||||||||||||||||||||||||||||||||||||
| Government debt securities | ( |
||||||||||||||||||||||||||||||||||||||||||||||
| Alternative investments: | |||||||||||||||||||||||||||||||||||||||||||||||
Diversified investment funds (1)
|
— | — | — | — | — | — | |||||||||||||||||||||||||||||||||||||||||
Limited partnerships (1)
|
— | — | — | — | — | — | |||||||||||||||||||||||||||||||||||||||||
| Total fair value | $ | $ | ( |
$ | $ | $ | $ | ||||||||||||||||||||||||||||||||||||||||
| Unsettled transactions, net | ( |
||||||||||||||||||||||||||||||||||||||||||||||
| Total plan assets | $ | $ | |||||||||||||||||||||||||||||||||||||||||||||
__________________
The following are descriptions of the valuation methodologies and key inputs used to measure pension plan assets recorded at fair value:
•Cash and cash equivalents—Cash equivalents include highly liquid investments with original maturities of three months or less. Due to their short-term nature, the carrying amount of these instruments approximates the estimated fair value. Actively traded money market funds are classified as Level 1 and included in cash and cash equivalents.
•Equity securities—The fair value of equity securities is based on quoted prices in active markets and classified as Level 1. Level 1 financial instruments include highly liquid instruments with quoted prices, such as equities and mutual funds traded in active markets.
•Commingled funds—The fair value of commingled funds is measured using the NAV per share practical expedient and have not been categorized in the fair value hierarchy. The NAV per share is based on the fair
137
value of the underlying assets owned by the funds, minus its liabilities then divided by the total number of shares outstanding. Underlying assets of commingled funds primarily consist of liquid equity and fixed income securities with quoted prices in active markets.
•Fixed income—When available, the fair value of fixed income securities is based on quoted prices in active markets and classified as Level 1. Level 1 financial instruments include highly liquid instruments with quoted prices, such as equities and mutual funds traded in active markets.
If quoted prices are not available, fair values of fixed income instruments are obtained from pricing services, broker quotes or other model-based valuation techniques with observable inputs and classified as Level 2. The nature of these fixed income instruments include instruments for which quoted prices are available but traded less frequently, instruments whose fair value has been derived using a model where inputs to the model are directly observable in the market, or can be derived principally from or corroborated by observable market data and securities that are valued using other financial instruments, the parameters of which can be directly observed. Level 2 fixed income instruments include corporate debt securities.
•Alternative investments—The fair value of alternative investments is measured using the NAV per share practical expedient and have not been categorized in the fair value hierarchy. The NAV per share is based on the fair value of the underlying assets owned by the alternative investment funds, minus its liabilities then divided by the total number of shares outstanding.
•Limited partnerships—The fair value of limited partnerships is measured using the NAV practical expedient and has not been categorized in the fair value hierarchy. The NAV is based on the fair value of the underlying assets owned by the partnership, minus its liabilities then multiplied by the ownership percentage of the pension plans.
Other Financial Instruments
We determine the fair value of fixed-rate debt using Level 2 inputs based on quoted market prices. The carrying amount of all other debt approximates fair value as those instruments are based on variable interest rates. The following table presents the fair value and carrying value of total debt as of December 29, 2024 and December 31, 2023:
| December 29, 2024 | December 31, 2023 | ||||||||||||||||||||||
| Fair Value | Carrying Value | Fair Value | Carrying Value | ||||||||||||||||||||
| (in millions) | |||||||||||||||||||||||
| Debt | $ | $ | $ | $ | |||||||||||||||||||
The carrying amounts of cash and cash equivalents, accounts receivable, notes payable and accounts payable approximate their fair values because of the relatively short-term maturity of these instruments.
138
NOTE 17: RELATED PARTY TRANSACTIONS
The following tables present amounts of related party transactions and balances owed from and to related parties:
| December 29, 2024 |
December 31, 2023 |
||||||||||
| (in millions) | |||||||||||
Receivables from related parties (1)
|
$ | $ | |||||||||
Payables to and other current liabilities with related parties (2)
|
|||||||||||
________________
(1)Includes receivables from WH Group and its subsidiaries of $51 million and $34 million as of December 29, 2024 and December 31, 2023, respectively, as well as receivables from Murphy Family Farms of $45 million as of December 29, 2024. These balances are recorded in accounts receivable, net and prepaid expenses and other current assets on the consolidated balance sheets.
(2)Includes amounts due to UGFH of $16 million as of December 31, 2023, which includes $8 million related to income taxes. These amounts are included in accrued expenses and other current liabilities on the consolidated balance sheet. The remaining balances are included in accounts payable.
| Fiscal Year | |||||||||||||||||
| 2024 | 2023 | 2022 | |||||||||||||||
| (in millions) | |||||||||||||||||
Sales to related parties (1)
|
$ | $ | $ | ||||||||||||||
Payments to related parties (2)
|
|||||||||||||||||
________________
(1)Sales to related parties includes $388 million, $487 million and $471 million in sales to subsidiaries of WH Group, and $59 million, $4 million and $20 million in sales to certain equity method investees in fiscal years 2024, 2023 and 2022, respectively.
(2)Payments to related parties includes $494 million, $350 million and $520 million in payments to UGFH in fiscal years 2024, 2023 and 2022, respectively, which primarily consist of dividends. Payments also include $154 million, $183 million and $209 million to certain equity method investees in fiscal years 2024, 2023 and 2022, respectively, primarily for raw materials used in our hog production operations and cold storage fees.
NOTE 18: REGULATION AND CONTINGENCIES
Like other participants in our industry, we are subject to various laws and regulations administered by federal, state and other government entities, including the U.S. Environmental Protection Agency and corresponding state agencies, as well as the USDA, the Grain Inspection, Packers and Stockyard Administration, the U.S. Food and Drug Administration, the U.S. Occupational Safety and Health Administration, the Commodity and Futures Trading Commission and similar agencies in foreign countries.
We, from time-to-time, receive notices and inquiries from regulatory authorities and others asserting that we are not in compliance with such laws and regulations. In some instances, litigation ensues. In addition, individuals may initiate litigation against us.
Our policy for establishing accruals and disclosures for contingent liabilities is contained in “Note 1: Summary of Significant Accounting Policies.” As of December 29, 2024 and December 31, 2023, we had recorded $141 million and $315 million in accrued expenses and other current liabilities on the consolidated balance sheets, respectively, related to litigation matters, including those described below. We recorded charges of $5 million, $213 million and $12 million in fiscal years 2024, 2023 and 2022, respectively, for litigation matters, including those described below, in SG&A in the consolidated statements of income. These matters will not affect our profits or losses in future periods unless our accruals prove to be insufficient or excessive. It is reasonably possible that a change in our estimates may occur in the near term and that our accruals could be insufficient. We are unable to estimate the amount of possible loss in excess of our accruals, which could be material. Additionally, legal expenses incurred in our and our subsidiaries’ defense of these claims and any payments made to plaintiffs through unfavorable verdicts or otherwise could negatively impact our cash flows and our liquidity position.
139
Antitrust Price-Fixing Litigation
The Company has been named as one of 16 defendants in a series of class actions filed in 2018 in the U.S. District Court for the District of Minnesota alleging antitrust violations in the pork industry. The class cases were filed by three different groups of plaintiffs. In all of these cases, the plaintiffs alleged that starting in 2009 and continuing through at least June of 2018, the defendant pork producers agreed to reduce the supply of hogs in the U.S. in order to raise the price of hogs and all pork products. The plaintiffs in all of these cases also challenged the defendant pork producers’ use of benchmarking reports from defendant Agri Stats, Inc., alleging that the reports allowed the pork producers to share proprietary information and monitor each producer’s compliance with the supposed agreement to reduce supply. Payments in the aggregate amount of $194 million were made by us to settle all class claims.
In addition to the class actions, the Company has been named as a defendant in similar antitrust lawsuits and related claims brought by a number of individual parties who opted out of the classes. The plaintiffs in the non-class cases assert the same or similar antitrust claims as the plaintiffs in the class actions. The Company has entered into negotiations with many of these claimants and has settled certain of these cases. Currently, 22 of these cases are pending against the Company.
The Attorneys General for the states of New Mexico and Alaska and the Commonwealth of Puerto Rico have filed similar complaints on behalf of their respective states, territories, agencies and citizens. The Company has settled with Puerto Rico and Alaska. The Company intends to vigorously defend against the remaining claims.
Antitrust Wage-Fixing Litigation
On November 11, 2022, Smithfield Foods, Inc. and our wholly owned subsidiary, Smithfield Packaged Meats Corp., were named as two of the numerous defendants in a purported class action complaint filed in the U.S. District Court for the District of Colorado alleging wage-fixing violations in the red meat industry. The plaintiffs allege that the defendants, most of whom operate beef or pork processing plants, conspired to suppress wages paid to plant workers in the U.S. in violation of the antitrust laws. The plaintiffs sought damages on behalf of all employees of defendants and their subsidiaries from January 1, 2014, to the present. The plaintiffs also sought treble damages and attorneys’ fees. The defendants filed motions to dismiss the complaint, which were largely denied by the court on September 27, 2023. The plaintiffs subsequently amended their complaint adding additional defendants, including our wholly owned subsidiary, Murphy-Brown of Missouri, LLC (which has been dismissed voluntarily), and expanding the class period back to 2000.
Since the case was filed, several defendants have settled. On April 5, 2024, the remaining defendants moved to dismiss the amended complaint. We intend to vigorously defend against these claims.
Maxwell Foods Litigation
On August 13, 2020, Maxwell Foods, LLC (“Maxwell”) filed a complaint against Smithfield Foods, Inc. in the General Court of Justice, Superior Court Division for Wayne County, North Carolina. The complaint alleged that Smithfield breached the Production Sales Agreement (“PSA”) between the parties (as well as the duty of good faith and fair dealing): (1) by failing to provide Maxwell with the same pricing as other major hog suppliers in violation of a purported “Most-Favored-Nation Provision” found in a December 6, 1994 letter to Maxwell, (2) by failing to comply with an implicit duty to negotiate the PSA to provide alternative pricing to Maxwell when the Iowa-Southern Minnesota market allegedly ceased to be viable; and (3) by failing to purchase Maxwell’s entire output of hogs since April 2020.
Smithfield filed a notice of removal to the U.S. District Court of the Eastern District of North Carolina. Smithfield also filed a motion to dismiss several of Maxwell’s claims. On February 22, 2021, the U.S. District Court granted Maxwell’s motion to remand the case to the Superior Court of Wayne County and left Smithfield’s partial motion to dismiss the complaint for consideration by the state court in Wayne County.
On March 1, 2021, Maxwell filed an amended complaint, which added a claim under the North Carolina Unfair and Deceptive Trade Practices Act (“UDTPA”). Smithfield filed a notice of designation seeking assignment of the case
140
to the North Carolina Business Court. Maxwell objected to such designation, and on April 13, 2021 the Business Court overruled Maxwell’s objection.
The Business Court also dismissed two of Maxwell’s claims: the implied duty to negotiate claim and the UDTPA claim. Maxwell subsequently filed another amended complaint adding a fraudulent concealment claim and a new breach of contract claim, as well as a request for punitive damages. The court dismissed the fraudulent concealment claim and the request for punitive damages. The three remaining claims, all for breach of contract, are: (1) the claim under the “Most-Favored-Nation Provision,” (2) the claim that Smithfield failed to purchase Maxwell’s entire output of hogs since April 2020, and (3) the claim that from time to time, Smithfield would calculate Maxwell’s payment for a delivery of hogs using an average of the preceding week’s weight rather than the actual weights of the hogs being delivered.
The parties filed cross-motions for summary judgment and related motions to exclude expert testimony, which were fully briefed on November 17, 2023. The parties filed cross-motions for summary judgment, and on December 30, 2024, the Business Court entered an order and opinion on the parties’ motions for summary judgment. The Business Court held that: (1) Maxwell’s claim for breach of a “Most-Favored-Nation Provision” was dismissed except as it relates to pricing given to one particular supplier; (2) Smithfield is liable for breaching an output provision in the parties’ contract, with damages to be determined at trial; and (3) Maxwell’s claim that Smithfield breached the pricing term of the parties’ contract by using live-weight pricing shall proceed to trial based on the allegation that Smithfield did not pay the correct live- weight price for certain deliveries, but not based on the allegation that use of live-weight pricing itself breaches the contract. The Business Court has set a trial date of June 9, 2025. We intend to vigorously defend against the remaining claims.
Insurance Claims
A fire at one of our pork processing facilities in North Carolina in 2021 damaged or destroyed assets and disrupted our business. Additionally, we have claims against certain of our insurance carriers for losses we incurred in connection with nuisance litigation in the State of North Carolina as well as in connection with inventory spoilage at a third party cold storage facility. We maintain comprehensive general liability and property insurance, including business interruption insurance, with loss limits that we believe will provide substantial and broad coverage for the losses arising from these events.
In connection with our claims associated with these matters, we received insurance proceeds totaling $31 million, $3 million and $6 million in fiscal years 2024, 2023 and 2022, respectively. We recognized $2
Any additional insurance recoveries from these claims will be recognized if and when the claims are settled.
NOTE 19: SUPPLEMENTAL CASH FLOW INFORMATION
| Fiscal Year | |||||||||||||||||
| 2024 | 2023 | 2022 | |||||||||||||||
| Supplemental disclosures of cash flow information: | (in millions) | ||||||||||||||||
Interest paid |
|||||||||||||||||
Income taxes paid |
|||||||||||||||||
ITEM 9. CHANGES IN AND DISAGREEMENT WITH ACCOUNTANTS ON ACCOUNTING AND FINANCIAL DISCLOSURE
Not applicable.
141
ITEM 9A. CONTROLS AND PROCEDURES
Evaluation of Disclosure Controls and Procedures
At the end of the period covered by this Annual Report on Form 10-K, we evaluated, under the supervision and with the participation of management, including our Chief Executive Officer (“CEO”) and Chief Financial Officer (“CFO”), the effectiveness of the design and operation of our disclosure controls and procedures (as defined in Rule 13a-15(e) and 15d-15(e) under the Securities Exchange Act of 1934, as amended (the “1934 Act”)). Our disclosure controls and procedures are designed to ensure that information required to be disclosed in the reports that we file or submit under the Exchange Act, is: (1) recorded, processed, summarized, and reported, within the time periods specified in the SEC’s rules and forms; and (2) accumulated and communicated to our management, including the CEO and CFO, to allow timely decisions regarding required disclosure. Based on our evaluation, our CEO and CFO concluded that, as of the end of the period covered by this Annual Report on Form 10-K, our disclosure controls and procedures were effective.
Management’s Annual Report on Internal Control Over Financial Reporting
Our Annual Report on Form 10-K for the fiscal twelve months ended December 29, 2024 does not include a report of management's assessment regarding internal control over financial reporting or an attestation report of the Company's registered public accounting firm due to a transition period established by rules of the Securities and Exchange Commission for newly public companies.
Changes in Internal Control Over Financial Reporting
During the fiscal year ended December 29, 2024 there were no changes in the Company’s internal control over financial reporting that have materially affected, or are reasonably likely to materially affect, the Company’s internal control over financial reporting.
ITEM 9B. OTHER INFORMATION
(1) Disclosure in Lieu of Reporting on a Current Report on Form 8-K.
None.
(2) Insider Trading Arrangements and Policies.
During the fiscal quarter ended December 29, 2024, no director or officer of the Company adopted terminated
ITEM 9C. DISCLOSURE REGARDING FOREIGN JURISDICTIONS THAT PREVENT INSPECTIONS
None.
PART III
ITEM 10. DIRECTORS, EXECUTIVE OFFICERS AND CORPORATE GOVERNANCE
Information required by this Item 10 will be included under headings “Board of Directors,” “Section 16(a) Beneficial Ownership Reporting Compliance,” and “Board of Directors and Corporate Governance” in our definitive Proxy Statement for our Annual Meeting of Stockholders expected to be held on June 3, 2025 (“2025 Proxy Statement”). This information is incorporated by reference into this Annual Report on Form 10-K.
Information concerning Executive Officers is set forth in Part I to this Form 10-K, pursuant to Instruction to Item 401 of Regulation S-K.
142
Code of Ethics and Business Conduct
We have a Code of Business Conduct and Ethics that applies to all of our directors, officers and employees, including our chief executive officer, chief financial officer and chief accounting officer. Our Code of Ethics and Business Conduct is a “code of ethics,” as defined in Item 406(b) of Regulation S-K. We will make any legally required disclosures regarding amendments to, or waivers of, provisions of our code of ethics on our website.
Our Code of Business Conduct and Ethics is available on our website at www.smithfieldfoods.com.
Insider Trading Policy
We have an insider trading policy that governs the purchase, sale and other dispositions of the Company’s securities that applies to the Company’s directors, officers, employees, and the Company. We believe that our insider trading policy is reasonably designed to promote compliance with insider trading laws, rules and regulations, and listing standards applicable to the Company. A copy of our insider trading policy is filed as Exhibit 19 to this Form 10-K.
ITEM 11. EXECUTIVE COMPENSATION
Information required by this Item 11 will be included under the headings “Executive Compensation,” “Director Compensation,” “Compensation Committee Interlocks and Insider Participation,” “Compensation Committee Report,” and “Equity Award Grant Practices” in our 2025 Proxy Statement. This information is incorporated by reference into this Annual Report on Form 10-K.
ITEM 12. SECURITY OWNERSHIP OF CERTAIN BENEFICIAL OWNERS AND MANAGEMENT AND RELATED STOCKHOLDER MATTERS
Information required by this Item 12 will be included under the headings “Security Ownership of Certain Beneficial Owners and Management” and “Equity Compensation Plan Information” in our 2025 Proxy Statement. This information is incorporated by reference into this Annual Report on Form 10-K.
ITEM 13. CERTAIN RELATIONSHIPS AND RELATED TRANSACTIONS, AND DIRECTOR INDEPENDENCE
Information required by this Item 13 will be included under the headings “Certain Relationships and Related Transactions” and “Director Independence” in our 2025 Proxy Statement. This information is incorporated by reference into this Annual Report on Form 10-K.
ITEM 14. PRINCIPAL ACCOUNTANT FEES AND SERVICES
Information required by this Item 14 will be included under the heading “Ratification of Appointment of Independent Registered Public Accounting Firm” in our 2025 Proxy Statement. This information is incorporated by reference into this Annual Report on Form 10-K.
PART IV
ITEM 15. EXHIBITS, FINANCIAL STATEMENT SCHEDULES
The following documents are filed as a part of this report:
Exhibit Number |
Description of Exhibit |
|||||||
3.1 |
||||||||
3.2 |
||||||||
143
144
| 10.7† | ||||||||
| 10.8† | ||||||||
| 10.9† | ||||||||
| 10.10† | ||||||||
| 10.11† | ||||||||
| 10.12† | ||||||||
| 10.13† | Form of Smithfield Foods, Inc., Omnibus Incentive Plan Restricted Stock Unit Award Notice and Agreement for Non-Employee Directors (filed as Exhibit 10.15 to Amendment No. 1 to the Registration Statement on Form S-1 filed by the Registrant with the SEC on January 21, 2025 and incorporated herein by reference). |
|||||||
| 10.14† | ||||||||
| 10.15† | ||||||||
| 10.16† | ||||||||
| 19* | ||||||||
| 21.1* | ||||||||
| 23.1* |
Consent of Ernst & Young LLP. (PCAOB ID: |
|||||||
| 31.1* | ||||||||
| 31.2* | ||||||||
| 32.1** | ||||||||
| 32.2** | ||||||||
| 97* | ||||||||
*Filed herewith.
** Furnished herewith.
†Compensatory arrangements for director(s) and/or executive officer(s).
145
SMITHFIELD FOODS, INC. AND SUBSIDIARIES
SCHEDULE II VALUATION AND QUALIFYING ACCOUNTS
(in millions)
| Additions | ||||||||||||||||||||||||||||||||
| Balance at beginning of period | Charged to costs and expenses | Charged to other accounts | Deductions | Balance at end of period | ||||||||||||||||||||||||||||
| Allowance for credit losses: | ||||||||||||||||||||||||||||||||
| 2024 | $ | $ | $ | $ | ( |
$ | ||||||||||||||||||||||||||
| 2023 | ||||||||||||||||||||||||||||||||
| 2022 | ( |
|||||||||||||||||||||||||||||||
Allowance for returns and other sales adjustments: |
||||||||||||||||||||||||||||||||
| 2024 | $ | $ | $ | $ | ( |
$ | ||||||||||||||||||||||||||
| 2023 | ( |
|||||||||||||||||||||||||||||||
| 2022 | ( |
|||||||||||||||||||||||||||||||
| Inventory obsolescence reserve: | ||||||||||||||||||||||||||||||||
| 2024 | $ | $ | ( |
$ | $ | $ | ||||||||||||||||||||||||||
| 2023 | ||||||||||||||||||||||||||||||||
| 2022 | ||||||||||||||||||||||||||||||||
| Valuation allowance on deferred tax assets: | ||||||||||||||||||||||||||||||||
| 2024 | $ | $ | $ | $ | ( |
$ | ||||||||||||||||||||||||||
| 2023 | ||||||||||||||||||||||||||||||||
| 2022 | ||||||||||||||||||||||||||||||||
ITEM 16. FORM 10-K SUMMARY
Not applicable.
146
SIGNATURES
Pursuant to the requirements of Section 13 or 15(d) of the Securities Exchange Act of 1934, the registrant has duly caused this report to be signed on its behalf by the undersigned, thereunto duly authorized.
SMITHFIELD FOODS, Inc.
By: /s/ C. Shane Smith March 25, 2025
C. Shane Smith Date
Pursuant to the requirements of the Securities Exchange Act of 1934, this report has been signed below by the following persons on behalf of the registrant and in the capacities and on the dates indicated.
SIGNATURE |
TITLE |
DATE |
||||||||||||
/s/ C. Shane Smith |
Chief Executive Officer and Director |
March 25, 2025 |
||||||||||||
C. Shane Smith |
(Principal Executive Officer) |
|||||||||||||
/s/ Mark L. Hall |
Chief Financial Officer |
March 25, 2025 |
||||||||||||
Mark L. Hall |
(Principal Financial Officer) |
|||||||||||||
/s/ R. Allen Brobst |
Principal Accounting Officer |
March 25, 2025 |
||||||||||||
R. Allen Brobst, Jr. |
||||||||||||||
/s/ Long Wan |
Chairman |
March 25, 2025 |
||||||||||||
Long Wan |
||||||||||||||
/s/ Marie T. Gallagher |
Director |
March 25, 2025 |
||||||||||||
Marie T. Gallagher |
||||||||||||||
/s/ Lijun Guo |
Director |
March 25, 2025 |
||||||||||||
Lijun Guo |
||||||||||||||
/s/ Hank Shenghua He |
Director |
March 25, 2025 |
||||||||||||
Hank Shenghua He |
||||||||||||||
/s/ John A. Quelch |
Director |
March 25, 2025 |
||||||||||||
John A. Quelch |
||||||||||||||
/s/ Raymond A. Starling |
Director |
March 25, 2025 |
||||||||||||
Raymond A. Starling |
||||||||||||||
/s/ Hongwei Wan |
Director |
March 25, 2025 |
||||||||||||
Hongwei Wan |
||||||||||||||
/s/ Xiaoming Zhou |
Director |
March 25, 2025 |
||||||||||||
Xiaoming Zhou |
||||||||||||||
147